SUSTAINABLE CLEAN WATER SUPPLY MANAGEMENT IN THE SOUTH BALI, INDONESIA
Journal: Water Conservation and Management (WCM)
Author: I Gusti Lanang Made Parwita, I Gusti Bagus Sila Dharma, Mawiti Infantri Yekti, I Putu Gustave Suryantara Pariartha, Zeplin Jiwa Husada Tarigan
Print ISSN : 2523-5664
Online ISSN : 2523-5672
This is an open access article distributed under the Creative Commons Attribution License CC BY 4.0, which permits unrestricted use, distribution, and reproduction in any medium, provided the original work is properly cited
Doi: 10.26480/wcm.01.2024.01.10
Abstract
 The South Bali region has a vital function for Bali Province because, as the center of education, trade, and tourism, it has a rapidly growing population. The increasing need for clean water needs to be followed by integrated and sustainable fulfillment without reducing the water supply for Subak’s traditional agricultural irrigation system. This research aims to determine the solution for a sustainable, balanced, clean water supply and demand in anticipating the future rapid population growth, decreased and unpredictable water sources, and Southern Bali as a National center of the tourism industry sector. The research method is a quantitative and qualitative approach to analyze the potential water supply and demand and provisioning designs based on future developments in the South Bali region. The results showed that the projected water demand in this area in 2025 is 5,587.22 liters/second, and in 2040 it is 7,313.10 liters/second while judging from water availability through municipal waterworks company and rural, this area only has water of 3,094.07 liters/second. Based on the analysis results, it can be conveyed that starting in 2025, this area will have a water shortage. The optimization of the extended storage of several rivers and integration of reservoirs with a total capacity of 2,380 liters/second could fulfill the sustainable water supply for Denpasar City. In addition, Badung Regency has long storage and reservoirs with a total capacity of 925 liters/second. The fulfillment of Gianyar Regency is carried out with long storage and pools with a total capacity of 670 liters/second. This result could pave the way for the local Government to manage and integrate the supply from different sources for the water requirement in 2025. While for the water supply beyond 2025, the Government needs to build and invest in new water sources.
Keywords
Clean water sustainability, South Bali region, water supply management
1. INTRODUCTION
A region’s economic growth impacts the availability of food, water needs, and space to carry out activities (Sahin et al., 2017). Water is essential in maintaining the survival of living things (Shuaib and Rana, 2020). Therefore, the problem of water availability is always very concerning (Abbas et al., 2023; Boutheina et al., 2022). This condition threatens the ecosystem with a dangerous and endangered situation (Gunda et al., 2019). Seasonal changes between dry and rainy and vice versa show extreme changes resulting in water supply fluctuations, which must be solved and planned well to ensure a sustainable clean water supply for society (Kanta and Berglund, 2015). At the same time, uneven economic and population growth and rainfall have become essential issues affecting water availability (Yan et al., 2022). Inconsistent rainfall results in a considerable amount of water discharge in the rainy season and even results in flooding. In contrast, when the dry season impacts drought, even the ground surface experiences cracks and dust (Qadafi et al., 2023). This condition results in changes in the ecosystem that is declining in the upstream area. Rainfall is unpredictable, so it takes various efforts to capture, store and make it a water source for needs (Yuksel, 2015). Moreover, the sustainability of available water resources highly depends on the environmental interactions that can provide water systems, social characteristics, and population growth (Ali et al., 2017; Sun et al., 2017; Aunsary and Chen, 2019). A study showed that in the future, there will be nearly 2 billion people will experience water shortages due to climate change and uncontrolled population growth (WHO, 2022).
In the case of Indonesia, the physical and social geographical character consists of archipelagic areas that form the only maritime country in the world. The Indonesian archipelago is surrounded by water and with a tropical climate that plays a significant role in maintaining the balance of the world’s ecosystem. However, water surrounding islands in the form of groundwater with extreme climate dynamics significantly affect the availability of clean water and requires a paradigm approach in water resources management (Fulazzaky, 2014; Choi et al., 2017). In addition, water needs continue to increase in line with population growth, particularly in the city region, community behavior in using water, and the development of an area into an industrial and economic area (Durán-Sánchez et al., 2018). Research indicated that rapid population growth negatively impacts water resources in quantity and quality (Idris et al., 2020). The rapidly growing population requires the need for more clean water by increasing production capacity (Säve-Söderbergh et al., 2020; Rajasekhar et al., 2018). Water needs for the community become a serious problem when it is unavailable, especially freshwater consumed by humans (Abdulhameed et al., 2022). Moreover, the availability of clean water is increasingly difficult to obtain due to increasing water pollution (Werkneh and Gebru, 2023). As a result, some residents in certain areas lack water services, as in urban poor Rajshahi City (Shuaib and Rana, 2020). While in other areas, the activities of residents consume water excessively and tend to produce water wastage.
Water availability, as the community’s primary need, tends to experience an imbalance with water needs (Cassivi et al., 2023). The requirement for more clean water and the existing water availability has resulted in an imbalance in the water supply (Choi et al., 2017). Society in certain areas such as the countryside around oil fields used hand pumps to obtain and supply the water for the community (Carrard et al., 2019; Pragst et al., 2017). However, in the urban area, managing water supply is complicated in provisioning and distributing to consumers including housing, industry, public facilities, commercial estate, and environment maintenance (Kanta & Berglund, 2015). Wurthmann revealed the importance of making projections of clean water needs in millions of gallons daily for new housing in Broward and Palm Beach Counties (Wurthmann, 2020).
Therefore, the balance between water availability and demand must be equalized in ensuring sustainable society life (Salau et al., 2021). Total water demand includes ecological water demand, domestic water demand, municipal water demand, agricultural water demand, and industrial water demand (Yan et al., 2022). Water availability exists when the amount of water flowing in and out as the cycle needs is equal (Chen et al., 2020). The river water supply, rainwater, and springs determine the water availability. On the other hand, water requirements are raw water, evaporation, evapotranspiration, and irrigation water (Chen et al., 2020; Boutheina et al., 2022). As discussed above, rapid population growth significantly impacts water quality and availability (Varady et al., 2016). Besides, climate change also has an impact on water availability (Zaporozhchenko et al., 2022). Recently, the flow of water has decreased over time due to a lack of rainfall and an increase in the earth’s temperature, increasing the water needs for ecosystem functions (Zlatanovic et al., 2018). In solving the lack of clean water, the Ghanaian Government involves the community in maintaining public water facilities to meet clean water needs in rural areas (Mangai and De Vries, 2018).
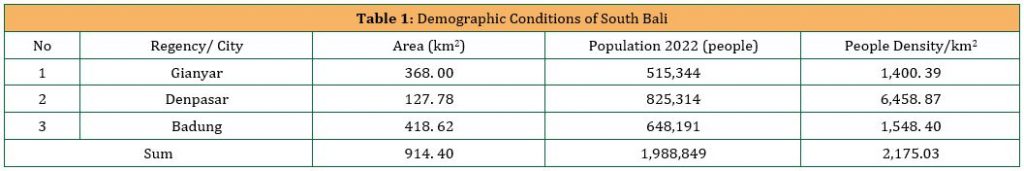
This study is concerned with the southern Bali region, one of the most popular tourism regions in the World. Besides, the southern Bali region has the highest population density and is the main tourism area in Bali Province. The South Bali region consists of three regencies/cities, namely Gianyar, Badung, and Denpasar City, with a total area covering 914.40 Km2 or 15.82% of the total area of Bali province. This region has a population of 1,788,849 people, or a percentage of 41.43% of the entire Population in Bali Province, with an average population density of 1. 856.31 people/km2, which is much higher than the population density in Bali Province at a density of 746.95 people/km2.
Besides, the rapid development of tourism in this region has increased the need for clean water due to non-domestic requirements. The availability of clean water is essential in supporting the community’s ability to host tourism industry activities. Clean water availability is adequate when it has met and fulfilled the needs of the community in their daily needs in terms of quantity and quality. The quality of water available has met the requirements for human health standards, and water is always available whenever needed. The provision of clean water that needs to be qualified can affect the degree of public health, economic productivity, and community quality of life. Providing adequate clean water is closely related to the conditions of the natural environment in a region and is a crucial component of sustainable human development. Providing sufficient clean water is closely related to the needs of the natural environment in an area and is a critical component of sustainable human development. Moreover, the provision of adequate clean water contributes to reduced mortality and is closely related to the characteristics of sustainable economic growth.
Bali is a world-famous tourist area, so it is mandatory to maintain water availability with the changes that occur. The South Bali government is expected to be able to determine water availability despite the extensive urbanization of the community and a center of the tourism industry, increasing water pollution, increasingly unpredictable climate change, and lack of attention to good management. Based on the explanation above, the study aims to explore and determine the solution for a sustainable, balanced clean water supply and demand in anticipating the increasing population density, unpredictable climate change, decreased raw water sources, and the region as a center of tourism industry growth. Therefore, this study set four significant goals: Forecasting population growth in South Bali. Second, the projection of the availability of clean water requirement in South Bali, and third, determining the solution for a sustainable balance of demand and supply of clean water in South Bali. Finally, the fourth is designing a plan to achieve a sustainable balance of population growth with water availability.
2. LITERATURE REVIEW
2.1 The Importance of Water
The rapid populations growth has caused an increased the water requirement in terms of quantity and quality (Yan et al., 2022). Moreover, the existing water sources which are not evenly distributed, and irregular unpredictable rainfall has caused water scarcity in certain region (Yuksel, 2015). A study indicated that water is transformed into an item of economic value that supports the development of a country by ensuring the quality of drinking water is met (Säve-Söderbergh et al., 2020; Carrard et al., 2019). In 2020, most of the world’s population enjoyed adequate water services, except in Africa and certain are in Asia, which experienced water shortages. But by 2050, it is estimated that most African countries and some countries in Asia will experience problems related to clean water due to rapid population growth and decreased of raw water sources. For example, Bangladesh has slums that do not have access to a reliable water supply for daily necessities (Shuaib and Rana, 2020). The Australian Government establishes policies and water resources management to achieve water security and adapt to overcome drought by identifying water sources that rely on rainfall and utilize seawater with an appropriate treatment (Sahin et al., 2017). Water is one of the basic needs for human life sustainability, and it should become one of the Government’s top priorities to provide.
A study in Turkey shows that the industrial sector’s water usage increased from 5 billion m3 (11%) in 2008 to 22 billion m3 (20%) in 2023. In contrast, there is a decrease in the percentage of agricultural sector usage from 74% in 2008 to 64% in 2023 (Yuksel, 2015). Water scarcity in various parts of the world increases provisioning efforts, stipulating an integrated cross-sectoral collaboration to establish an integrated water management policy (Zlata-novic et al., 2018; Venegas-Quiñones et al., 2020). Integration was initially intended purely for water fulfillment, but in its later development, it concerned other sectors supported by adequate water availability (Boretti and Rosa, 2019). In the southern Bali region, particularly in the previously mentioned four cities, the local Government manages the provision of water supply. However, the rapid population growth, the uncertainty of rainfall, the increased industrial requirement, and the growth of the tourism sector has resulted in the indication of clean water shortage in that region. The Government of Southern Bali needs to anticipate these potential issues before it emerges.
2.2 Water Availability/Usage
The use of clean water is influenced by several factors, including climate, city size, type of industry, and water tariffs (Matthews, 2022; Kanta and Berglund, 2015). Some areas that have hotter climates will require more water than cold regions. Likewise, the larger the size of the city, it requires more per capita water needs. A group researchers stated that urban populations would consume more water and require large capacities to meet their needs adequately (Säve-Söderbergh et al., 2020). Similarly, people in hot areas need more water for their domestic needs, so each district and city have its own needs (Ma et al., 2023). Therefore, the size of the town and the activities of the population in it affect water use. Some researchers stated that water consumption, water use efficiency, and pollution determine water availability as redlines in China (Yan et al., 2022).
Large cities with dense populations have greater water requirements when compared to small cities (Rajasekhar et al., 2018). Some large cities that have slums do not have access rights to clean water (Shuaib and Rana, 2020). The occurrence of differences between one region and another, even between cities in adequate settlements, will be able to access clean water compared to low-income settlements, which are difficult to access (WHO, 2022). It is shown that water requirements for small cities with low standard housing range from 90 to 150 liters/person/day, while for large and modern cities, clean water can reach 600 liters/person/day. Domestic water needs in Indonesia are divided into several categories, namely: city category I (metropolitan), city category II (big city), city category III (medium city, city category IV (small city), and city category V (village) (PUPR, 2007). The type of industry that exists in an area affects water usage patterns. The total water needs in Indonesia to meet population and economic growth of 1074 m3/second, while availability in minimum conditions is 790 m3/second, so there is a 284 m3/second shortage in meeting irrigation, household, urban and industrial needs (Fulazzaky, 2014).
Clean water needs can be divided into two groups, namely domestic water needs and non-domestic water needs. Domestic water needs include water needs inside and outside the home and public faucets. Water is needed in the place needed to drink, cook, sanitize, clean the house, and wash clothes and vehicles (Carrard et al., 2019). At the same time, outdoor needs include water gardens, fountains, and swimming pools. The need for public faucets is the need for faucets utilized by the public. Non-domestic water needs are other than for purposes inside and outside the house and public faucets. Non-domestic water needs include industry, agencies/offices, public facilities, farms, schools, hotels, restaurants, and places of worship (Ma et al., 2023). The domestic and non-domestic water needs and loss during distribution constitute total water needs (Cassivi et al., 2023). Domestic and non-domestic water needs depend on the distribution system owned by producers or providers. Research in Peru indicated that increased water use is critical for companies and communities, hence it needs to ensure adequate water access, availability, and reliability (Bunclark and Scott, 2022). Similalrly, the need for clean water for barley production in the U.K., as the main ingredient of animal husbandry, has increased the need for meat worldwide (Yawson et al., 2020).
Meanwhile, non-domestic water need is determined by various variations in its use for industry, schools, offices, and houses of worship. Some people/agencies estimate the amount of non-domestic water demand based on the percentage of domestic water demand. Nondomestic water demand is estimated at 20% – 25% of household water demand. Indonesian Ministry of Public Works and Public Housing (PUPR, 2007), calculates the amount of non-domestic water demand at 20%-30% of domestic water demand. The management of the water supply is complicated and critical for the sustainability of clean water and the Government needs to take care of this issue. The Government of Ghana assigned the National Community Water and Sanitation Agency to regulate the development and provision of funds for the availability of clean water based on resource contribution (Mangai and De Vries, 2018).
2.3 Population Growth
Population projections obtain a future population picture for various purposes (Vanella et al., 2020; Budi et al., 2021; Mekonnen, 2023). In this case, population projections are carried out to estimate the population in the future concerning the total amount of water use that needs to be provided, especially the availability of water in urban areas (Silva and Omaña, 2023). In the analysis of population, the projection uses several methods according to population characteristics (Boretti and; Rosa, 2019). For example, projections of new connection-related needs requiring household water demand in Broward and Palm Beach, Florida, can be projected from 2020 to 2060 by determining and using related data to analyze widely applied residential rainwater harvesting (Wurthmann, 2020). Population growth is calculated using arithmetic, geometric, and exponential métode calculations l. Arithmetic calculations used in research with equation 1.
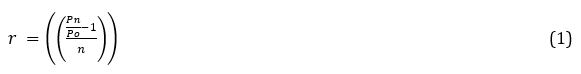

The calculation of the population is determined by each sub-district area and adjusted to the calculation method that best suits the population growth of each region. Then, it is accumulated to obtain a projection of the Population for South Bali. A good projection is a projection that results in a deviation between the results of the forecast and reality that has a slight difference; in other words, it has the lowest error rate in projecting. Wurthmann calculated the amount of water demand by looking at population projections using population growth data, the increase in the number of new housings, and calculating the average ratio of the number of detached houses to the number of people between 2010-2017 for Broward and Palm Beach Counties (Wurthmann, 2020). The calculation of water needs for the industry in Hebei province; China is estimated in 2025 under normal conditions 2743.20 M3 and in 2035, it is estimated at 2830.68 M3 in detail, the demand for water needs of each district/city has different needs (Ma et al., 2023).
2.4 Balanced Water Supply
The global demand for clean water has increased significantly due to increase per capita consumption, particularly in developing countries with inadequate incomes (Qadafi et al., 2023). The interaction of water systems and population growth can cause supply-demand imbalances on various time scales and consumer behavior in utilizing water (Ali et al., 2017). The estimate of needs is determined by population projections that have developed from previous years and in the future under certain conditions to estimate the shortage and excess of resources owned (Vanella et al., 2020). Water availability in the hemisphere is not always evenly distributed everywhere and at every time, as expected (Mekonnen, 2023). Humans with various interests in water try to fulfill different ways from various competencies possessed and in multiple ways legitimization and participation in an integrated manner (Fulazzaky, 2014). Water resources management approaches in the past have not been adequate to face global water management challenges, including water use efficiency (Yan et al., 2022; Abdulhameed et al., 2022).
Management approaches are mostly sectoral, where each sector (household use, agriculture, industry, environmental protection, etc.) has been managed separately, with limited coordination between sectors (Kanta and Berglund, 2015). This approach leads to fragmented and uncoordinated development of water resources (Matthews, 2022). Many waters use has spillover effects on other uses and sometimes have unintended social and environmental consequences. This is especially true for watersheds where upstream water and land practices directly impact downstream water quantity and quality (Venegas-Quiñones et al., 2020). For this reason, adequate integrated water management is needed with the relationship between water quantity, water quality, and community (Gunda et al., 2019; Werkneh and Gebru, 2023). As water becomes scarcer, it becomes increasingly inefficient to manage water without acknowledging the interdependence between institutions, sectors, and geographical regions (Durán-Sánchez et al., 2018).
The concept of integrated water resources management has been necessary for a long time and is increasingly developing following current and future developments (Säve-Söderbergh et al., 2020). The management of providing water resources that can be integrated between watersheds and regions as needed becomes a challenge in the future, so adaptive integrated water management is needed to climate change (Zlatanovic et al., 2018). Integrating water resources management balances economic, environmental, and ecological issues (Mangai and De Vries, 2018). It must be supported by management structures, environmental management policies, and institutional/institutional strengthening. The combination of these structures gives birth to water balance to support human life (Chen et al., 2020).
The Government tries to meet the need for clean water for the community (Zaporozhchenko et al., 2022). The balance between available sources is compared to the water needs in the community. Water availability is the supply side in natural resources (surface water and groundwater) and non-conventional resources, namely brackish water, wastewater, and other water. The need for water for communities and companies in Peru remains a concern that water resources are declining and have a major impact on poverty and vulnerability of life because a quarter of the population has a profession as farmers and is also involved in agricultural activities (Bunclark & Scott, 2022). Water needs for the community are divided based on high consumption patterns of domestic use, agriculture, and industry. In contrast, low consumption patterns consist of navigation, hydropower generation, aquatic environment, and recreation. The willingness of citizens to actively participate in providing time and funds to maintain access to clean water facilities can provide sustainable development (Mangai and De Vries, 2018). Sustainable development aims to carry out development activities that lead to human welfare without reducing the rights of future generations to enjoy the same resources (Durán-Sánchez et al., 2018).
The availability of drinking water for the community is essential. The provisioning of drinking water in Singapore involves private parties working synergistically to provide clean water and adequate funds. In contrast, Mexico has not involved private parties in line with the Government in carrying out clean water management and treatment (Silva and Omaña, 2023). The development carried out has a welfare effect and the preservation of resources for future generations. Sustainable development is a sustainable development effort following the capacity of existing resources (Aunsary and Chen, 2019). A group researchers project that water demand in the U.K. will increase with climate change, agricultural land use for barley, and population changes will increase water demand between 206 to 350 million M3 (Yawson et al., 2020). Global worldwide water demand for all services is estimated 2050 to be projected at 6000 KM3 per year and an increase of 30%.
Forecasted global water demand in agriculture will increase by 60%, with an estimated human increase of 10.2 million people by 2050 (Boretti and Rosa, 2019). In line with the concept above, the sustainable development goals include a scope of activities that contain several criteria, namely: equitable distribution of development between generations and security of natural resources in a sustainable manner, utilization, and management of natural resources in terms of various aspects that lead to prosperity equally. Maintain the sustainable welfare of the people both now and in the future, maintain the benefits of development or management of natural resources and the environment that have long-term or sustainable benefits between generations and maintain the quality or quality of human life between ages following their habitat.
3. RESEARCH METHODS
This study is exploratory research to determine the availability of clean water in the South Bali region by considering population growth. Data is collected at related agencies such as statistical offices, river basin offices, municipal waterworks companies, and other agencies. Data collection includes various related data such as the area of administrative area and Population of Bali Province, along with the area and population of each regency/city under it. Watershed administration area data was obtained at the Ministry of Public Works and Spatial Planning through the Bali Penida River Basin Hall. The data taken include watershed area (km2) and length of the main river (km). Data on the performance of district/city-
level clean water companies concerning data: water production, water type (surface water and underground water), water distribution, service coverage, water loss, customer clusters, water tariffs, and service development policy systems are taken at the municipal waterworks companies office. Clean water development system data was obtained at the office of the ministry of public works and public housing, Directorate general of drinking water planning system and directorate general of water resources, Bali Penida River regional hall, Bali regional infrastructure and settlement center, regency/city drinking water company, regency/city regional development planning agency. The data taken includes infrastructure that has been built and its capacity and infrastructure plans that will be built in the future.
Population numbers are obtained through the offices of the central bureau of provincial and regency/city statistics. The data taken include the number of inhabitants and population growth rate. The analysis carried out consists of a study of water potential, water availability, population projections, and water needs, as well as a strategic analysis of the clean water supply system in the southern Bali Region. Data is calculated using SPSS and Microsoft Excel according to research data needs.
4. RESULTS AND DISCUSSION
4.1 Region profile
Gianyar Regency, Denpasar City, and Badung Regency, located in the south of Bali Province, have several advantages that make this area the center of government, education center, business activities, and government activities. One of this region’s advantages is the completeness of infrastructure, especially in the fields of energy and water evenly distributed. In addition, transportation infrastructure such as airports and seaports are also available in this region. Advanced socio-cultural and tourism conditions and Denpasar’s position as the provincial capital make this region experience rapid development. This rapid development has an impact on the increasing need for clean water. The view of southern Bali can be seen in Figure 1.
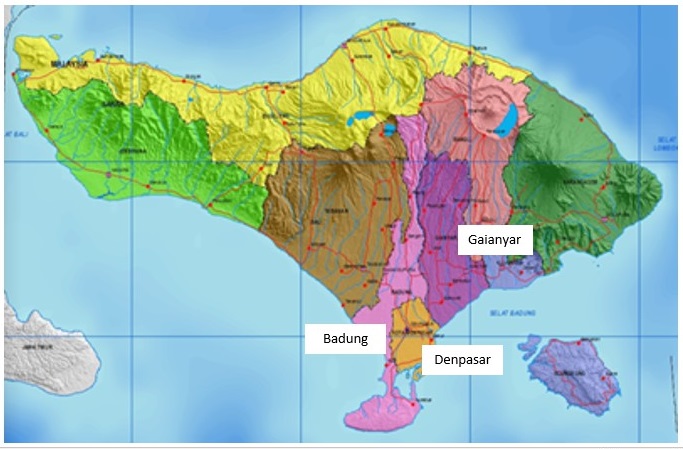
Figure 1: Location of Gianyar Regency, Denpasar City, and Badung Regency
South Bali, with three regencies, Gianyar, Denpasar, and Badung, has an area of 914.40 km2, or 15.82% of the total area of Bali Province. The population density in Denpasar City is the highest in the southern Bali Region, with a density of 6. 458.87 people/km2, while the population density in Gianyar is 1. 400.39 people/km2. In Badung Regency, it is 1. 548.40 people/km2. The overview of the area, population, and density of these three regions can be seen in Table 1 below:
4.2 Population projection of South Bali Region
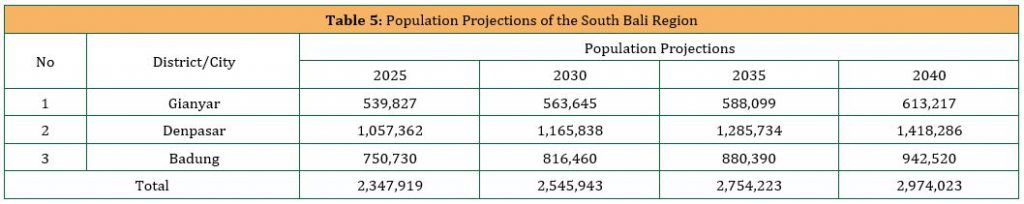
Analysis of population projections is carried out by simulating the calculation of population from various methods, both arithmetic, geometric, and exponential. In the end, what is used is one of the calculation methods that best suit the population’s characteristics today. Based on the data collected in the 2010-2020 period, the amount of population projection was determined using arithmetic, geometric, and exponential approaches following the characteristics of population data in each sub-district. As a result, the population projection of each sub-district, district, and city in 2025, 2030, 2035, and 2040 are presented in Table 2, Table 3, Table 4, and Table 5.

Based on Table 2, the projected Population of Gianyar Regency in 2025 will be 539,629 people; in 2030, it will be 563,645 people. In 2035 it will be 588,099 people, and in 2040 it will be 613,217 people.
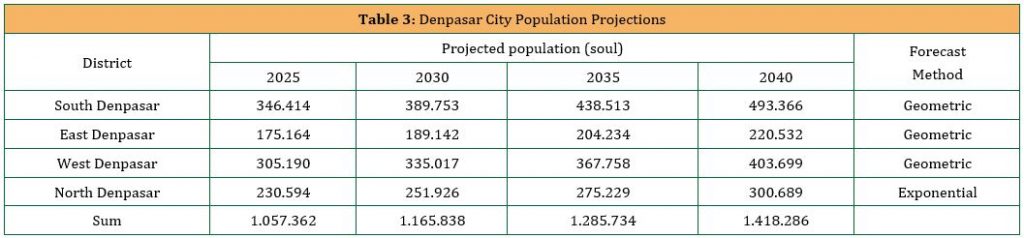
Based on Table 3, the projected population of Denpasar City in 2025 is 1,057,362 people; in 2030, it will be 1,165,838 people; in 2035, it will be 1,285/734 people and in 2040, it will be 1,418,286 people. Based on Table 4, the projected population of Badung Regency will be 750,730 people in 2025, 816,460 people in 2030, 880,390 in 2035, and 942,520 in 2040. Based on the calculation results in Table 1, Table 2, and Table 3, the population projections in the South Bali area can be determined (Table 4).

4.3 Analysis of clean water needs
Clean water needs in Bali are calculated based on the population and projections by considering the number of water leaks and water use for allocating non-domestic water needs. Water leakage is very dependent on the current condition of the network. Researchers carefully conducted a study with each municipal water works company in southern Bali, with estimates of water leakage ranging from 20-30%. Therefore, water needs for domestic water needs are highly dependent on the characteristics of each region. Based on survey data and analysis from each study area, the average per capita water demand in Denpasar City is 140 liters/person/day, Badung Regency is 130 liters/person/day, and Gianyar Regency is 130 liters/person/day. The results of the analysis of the calculation of water need in the South Bali Region can be seen in Table 3 below:
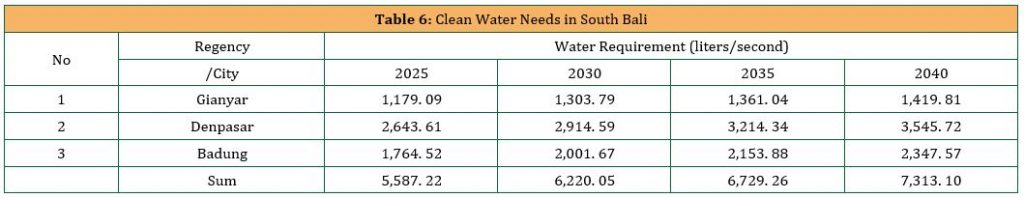

Figure 2: Water Needs of South Bali
Table 6 and Figure 2 show that water use for the Denpasar City area is an area whose per capita water use is greater than the Gianyar and Badung Regency areas.
4.4 Water Availability in South Bali Region
The supply of clean water in southern Bali is generally provided by two major groups, namely those provided by the Government through municipal water works company and those managed by local communities through rural clean water companies. Municipal water works company is a district-level regional company the Regent fully controls in their working area. Meanwhile, rural clean water companies are a company owned by the village and operated independently by the community. Some of the conditions that cause the existence of rural clean water companies are the difficulty of the village to get access to clean water from municipal water works company and the presence of springs in the village area that can be used as a source of rural clean water companies water sources. All rural clean water companies in this region are sourced from springs.
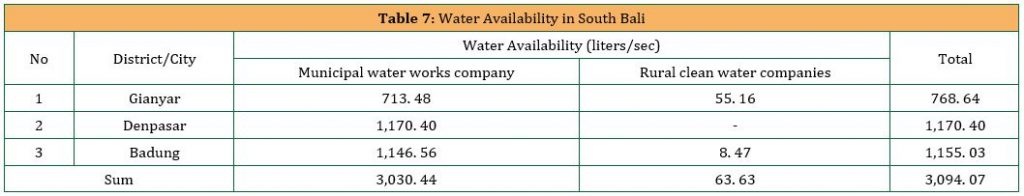
The total availability of water in the South Bali Region sourced from municipal water works company is 3,030.44 liters/second, while that sourced from rural clean water companies is 63.63 liters/second or 2.10%. Water availability in South Bali is based on data from municipal water works company and rural clean water companies, as shown in Table 7.
4.5 Water supply in the Southern Bali region
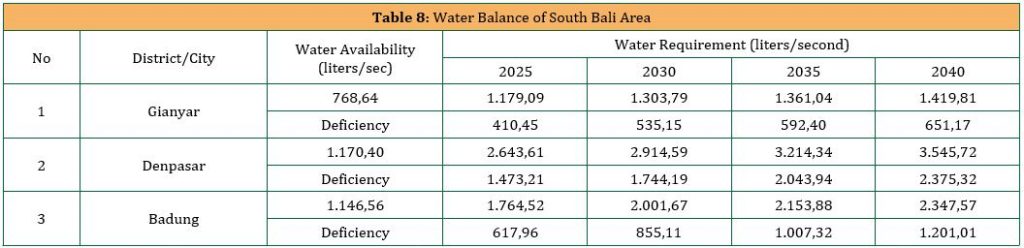
Based on water availability and demand data, it can be conveyed that almost all areas in the southern Bali region will experience water shortages in 2025. For example, Gianyar Regency will experience a water shortage of 410.45 liters / second, Denpasar City will experience a lack of 1,473.21 liters / second, and Badung Regency will experience a shortage of 617.96 liters/second. Furthermore, this shortage will be even greater in 2030, 2035, and 2040 if new infrastructure is not added. An overview of the water balance in the southern Bali region can be seen in Table 8.
4.6 Integrated and Sustainable Water Management.
Based on the analysis conducted on the southern Bali region, the most potential areas with water content are surface and subsurface. Most of the several potential rivers in the Bali region are in south Bali, making this area a very fertile irrigation area in Bali. The rivers in this region are rivers that flow throughout the year (perennial type). Some of these rivers are Sangsang, Pakerisan, Petanu, Oos, Ayung, Badung, Mati, and Sungi. From the current conditions, two rivers have been used as raw water in the form of long storage, namely Petanu longstorage with a capacity of 150 liters/second and Sungi longstorage with a total of 2250 liters/second. The downstream part of the Badung River has been used as a reservoir for clean water with a 500 liters / second capacity. From the results of measuring the short discharge in the estuary, it can be said that some rivers still have water downstream that can be used for clean water purposes in the future. Data on the results of instantaneous discharge measurements in several river estuaries that empty into this region can be submitted in Table 9.
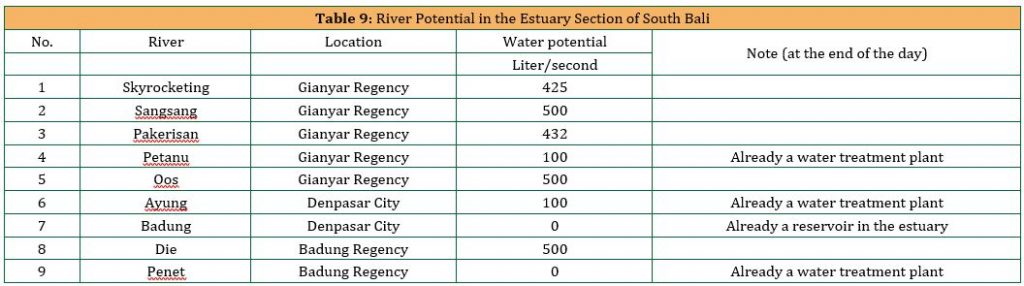
Based on Table 9 above, it can be said that among the nine rivers in this region, 4 of them have been used through Petanu, Penet, and Ayung, and one river, namely the Badung River, has been used for reservoirs. Five Other rivers that can still be used for raw water development are the Melangit, Sangsang, Pakerisan, Oos, and Mati rivers. Especially for the Mati River, the building structure has been provided but has not been equipped with a complete water treatment plant building.
Judging from the sustainable and integrated clean water development program in southern Bali, it can be conveyed as follows: First, the Denpasar City area. The production capacity of municipal water works company Denpasar City only reaches 1,170.4 liters/second. Suppose that the production capacity in 2040 has a clean water production capacity as it is today. In that case, Denpasar City will experience a shortage of clean water of 2,375.32 liters/second. To be able to meet these needs, several integrated and sustainable development plans are needed with schemes such as the following: optimization of Longstorage Penet with a capacity of 150 liters/second, optimization of longstorage Petanu with a capacity of 150 liters/second, stir Sarbagita with a capacity of 900 liters/second, Sarbaging with a capacity of 200 liters/second, w stir Muara Unda with a capacity of 850 liters/second, longstorage Sungai Mati with a capacity of 50 liters/second, longstorage Melangit with a capacity of 80 liters/second.
Second, the Badung Regency area is projected to require as much as 2,347.57 liters/second of clean water. Water production from municipal water works company Badung Regency reaches an average of 1,446.56 liters/second, and non- municipal water works company water production, such as rural clean water companies, has a capacity of 8.47 liters/second. Thus, if it is assumed that water production from municipal water works company will remain in 2040, Badung Regency is expected to experience a shortage of clean water of as much as 1,201.01 liters/second. To be able to meet these needs, several provision development plans are needed as follows: Sarbagita reservoir with a capacity allocation of 550 liters/second, Muara Unda reservoir with a capacity allocation of 100 liters/second, optimization of Penet Longstorage with a capacity allocation of 75 liters/second, optimization of Petanu Longstorage with a capacity of 50 liters/second, longstorage Mati river with a capacity of 50 liters/second and Muara Nusa Dua reservoir with a capacity of 100 liters/second.
Third, the area of Gianyar Regency. The clean water production capacity carried out by municipal water works company and non- municipal water works company in Gianyar Regency reaches 768.58 liters/second. However, this capacity has not met the need for clean water, projected to reach 1,419.81 liters/second in 2040. So that, Gianyar Regency will experience a shortage of clean water sources of as much as 651.17 liters/second. There are several plans to develop a clean water supply system to meet these water needs, including Sarbagita Reservoir with a capacity of 100 liters/second, Sarbaging Reservoir with a capacity of 50 liters/second, Muara Unda with 300 liters/second. Moreover, Petanu longstorage with 50 liters/second capacity, Melangit longstorage with 70 liters/second capacity, and Oos longstorage with 100 liters/second capacity. Based on the data analysis on the condition demography of South Bali, the growth of the Population in South Bali, the need for clean water in the surveillance of South Bali (Gianyar, Denpasar, and Badung), availability of clean water in South Bali and water balance in South Bali region than can be made the stages of development in Figure 5 and Figure 6. Planned integrated and sustainable water development in South Bali consisting of Denpasar City, Badung Regency, and Gianyar Regency.
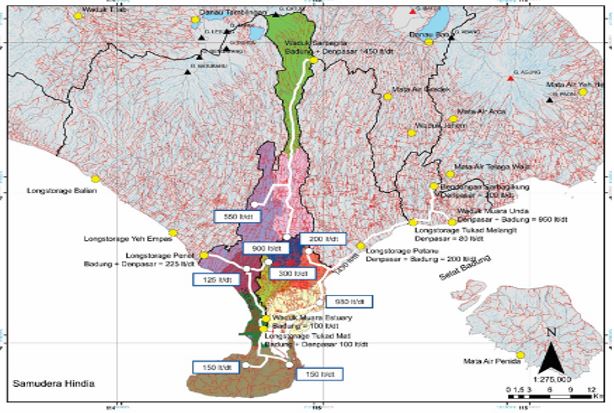
Figure 3: Integrated and Sustainable Water Resources Development Plan Denpasar and Badung City
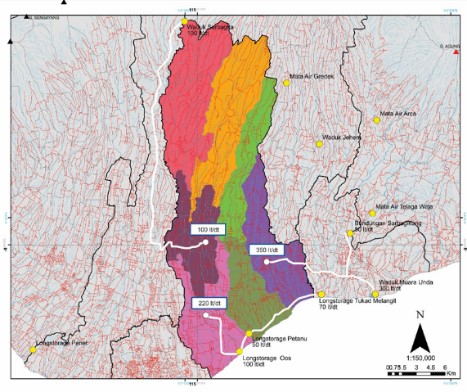
Figure 4: Integrated and Sustainable Water Resources Development Plan Gianyar District
Figure 5 shows that the Government, through the regional drinking water company, is trying to meet the community’s needs in the South Bali part by making water resources development plans in Denpasar and Badung Regions. The Government also does the same thing in Gianyar Regency. The Indonesian Government is prioritizing building water availability in South Bali, considering it the most prominent tourist center in Bali Province. The most significant number of people and facilities are in the area, making it the focus in preparation for sustainable water supply development.
5. CONCLUSION
As previously stated, this study aims to explore and determine the solution for a sustainable, balanced clean water supply and demand in anticipating the increasing population density, unpredictable climate change, decreased raw water sources, and the region as a center of tourism industry growth. Based on the earlier results of the analysis, the conclusion is withdrawn for the sustainable clean water supply for the region of South Bali region as follows: First, the total current clean water availability in the South Bali region for each district is as follows: Gianyar at 768.64 liters/second, Denpasar City at 1170.40 liters/second, and Badung Regency at 1155.03 liters/second. This capacity is supplied by municipal water works company and a small part by community-managed clean water companies. However, this supply is insufficient, leading to a water shortage starting in 2025. To fulfill the future requirement for clean water, it requires to integrate several nearby water supplies.
Gianyar Regency will be supplied from Sarbagita reservoir with 100 liters/second capacity, distributed to the Ubud District. Second, Sarbagita Reservoir, with an allocation capacity of 50 liters/second, will be distributed to Gianyar District. Finally, Muara Unda Reservoir will be distributed to Gianyar District with a 300 liters/second capacity. This composition of water supplies, a total of 450 liters/second. is expected to be sufficient to supply the water requirement for Gianyar Regency in 2025, with a distribution from Petanu Longstorage, 50 liters/second supply, will be distributed to Sukawati and Blahbatuh Districts. Melangit Longstorage, with a capacity of 70 liters/second, will be distributed to Gianyar District. Oos Longstorage with a 100 liters/second capacity will be distributed to Sukawati District.
Meanwhile, for Badung Regency the supply will be availabe from Sarbagita reservoir strategy with a capacity of 550 liters/second, Muara Unda reservoir with a capacity of 100 liters/second, optimization of Penet longstorage with an allocation of 75 liters/second, optimization of Petanu longstorage with a capacity of 50 liters/second, Mati River longstorage with a capacity of 50 liters/second, Muara Nusa Dua reservoir with a capacity of 100 liters/second. This integration of supply will serve the Badung Region with a total of 925 liters/second. Finally, Denpasar City with an optimized longstorage Penet with a 150 liters/second capacity to meet the needs in West Denpasar. Optimization of longstorage Petanu with a capacity of 150 liters/second to meet the needs in South Denpasar, Sarbagita Reservoir with a capacity of 900 liters/second to meet the requirements in North Denpasar.
Sarbagita reservoir with a capacity of 200 liters/second to meet the needs in East Denpasar. Muara Unda with a capacity of 850 liters/second to meet the requirements in South Denpasar. Longstorage Sungai Mati with a capacity of 50 liters/second to meet the needs in South Denpasar, and longstorage Melangit with a capacity of 80 liters/second to meet the requirements in South Denpasar. With this water supplies integration, the three regions of Southern Bali could have sufficient water supply in 2025 and several years beyond 2025. This result could pave the way for the local Government to manage and integrate the supply from different sources for the water requirement in 2025. While for the water supply beyond 2025, the Government need to build and invest in new water sources.
AUTHOR CONTRIBUTIONS
I G. L. M. Parwita: Conceptualization, Methodology, Data curation, Formal analysis, Writing-original draft; I.G.B. S. Dharma: Supervision, Project administration, Writing-review & editing; M. I. Yekti: Methodology, final analysis; I P. G. Suryantara: Correcting writing errors, Visualization, Conclusion; and Z. J. H. Tarigan: Background of research, Literature review, final article.
REFERENCES
Abbas, F., Al-Naemi, S., Farooque, A.A., and Phillips, M., 2023. A review on the water dimensions, security, and governance for two distinct regions. Water, 15, Pp. 208. https://doi.org/10.3390/w15010208
Abdulhameed, I.M., Sulaiman, S.O., Najm, A.B.A., and Al-Ansari, N., 2022. Optimising water resources management by Using Water Evaluation and Planning (WEAP) in the West of Iraq. Journal of Water and Land Development, 53(IV–VI), Pp. 176–186 DOI: 10.24425/jwld.2022.140795
Ali, A.M., Shafiee, M.E., and Berglund, E.Z., 2017. Agent-based modeling to simulate the dynamics of urban water supply: Climate, population growth, and water shortages. Sustainable Cities and Society, 28, Pp. 420-434, doi.org/10.1016/j.scs.2016.10.001
Aunsary, M.N., and Chen, B.C., 2019. Sustainable water treatment management. Water Conservation and Management, 3 (2), DOI : http://doi.org/10.26480/wcm.02.2019.11.13
Boretti, A., and Rosa, L., 2019. Reassessing the projections of the world water development report. npj Clean Water, 15 (2), Pp. 1-6. https://doi.org/10.1038/s41545-019-0039-9
Boutheina, D., Amel, M., Sami, K., Fatma, B.S., and Bassem, M., 2022. Agricultural water management practices in Mena Region facing climatic challenges and water scarcity. Water Conservation & Management, 6 (1), Pp. 39-44. DOI: http://doi.org/10.26480/wcm.01.2022.39.44
Budi, N.M.N., Sudiajeng, L., and Tapayasa, I.M., 2020. Perspective of population growth and clean water supply in Denpasar, Bali-Indonesia. Proceedings of the International Conference on Innovation in Science and Technology (ICIST 2020), DOI.10.2991/aer.k.211129.084
Bunclark, L.A., and Scott, G.J., 2022. Benchmarking corporate water reporting in emerging economies: the case of Peru. Sustainability Accounting, Management and Policy Journal, 13 (1), Pp. 114-151. https://doi-org/10.1108/SAMPJ-02-2020-0031
Carrard, N., Foster, T., and Willetts, J., 2019. Groundwater as a source of drinking water in Southeast Asia and the Pacific: a multi-country review of current reliance and resource concerns. Water, 11, Pp. 1605. https://doi.org/10.3390/w11081605
Cassivi, A., Covey, A., Rodriguez, M.J., and Guilherme, S., 2023. Domestic water security in the Arctic: A scoping review. International Journal of Hygiene and Environmental Health, 247, Pp. 114060, https://doi.org/10.1016/j.ijheh.2022.114060
Chen, S., Johnson, F., Drummond, C., and Glamore, W., 2020. A new method to improve the accuracy of remotely sensed data for wetland water balance estimates. Journal of Hydrology: Regional Studies, 29, Pp. 100689, https://doi.org/10.1016/j.ejrh.2020.100689
Choi, I.C., Shin, H.J., Nguyen, T.T., and Tenhunen, J., 2017. Water policy reforms in South Korea: A historical review and ongoing challenges for sustainable water governance and management. Water, 9, Pp. 717. https://doi.org/10.3390/w9090717
Durán-Sánchez, A., Álvarez-García, J., and Del Río-Rama, M.D.l.C., 2018. Sustainable water resources management: A bibliometric overview. Water, 10, Pp. 1191. https://doi.org/10.3390/w10091191
Fulazzaky, M.A., 2014. Challenges of integrated water resources management in Indonesia. Water, 6, Pp. 2000-2020. https://doi.org/10.3390/w6072000
Gunda, T., Hess, D., Hornberger, G.M., and Worland, S., 2019. Water security in practice: The quantity-quality-society nexus. Water Security, 6, Pp. 100022, https://doi.org/10.1016/j.wasec.2018.100022
Kanta, L., and Berglund, E.Z., 2015. Exploring tradeoffs in demand-side and supply-side management of urban water resources using agent-based modeling and evolutionary computation. Systems, 3, Pp. 287-308.
https://doi.org/10.3390/systems3040287
Leigh, N.G., and Lee, H., 2019. Sustainable and resilient urban water systems: the role of decentralization and planning. Sustainability, 11, Pp. 918. https://doi.org/10.3390/su11030918
Ma, J., Liu, H., Wu, W., Zhang, Y., and Dong, S., 2023. Research on optimal allocation of water resources in Handan City based on the refined water resource allocation model. Water, 15, Pp. 154. https://doi.org/10.3390/w15010154
Matthews, S., 2022. Independent water producers – The opportunities and the challenges for SA. Water Wheel, 21 (3), Pp. 15-17. https://journals.co.za/doi/abs/10.10520/ejc-waterb-v21-n3-a4
Mangai, M.S., and De Vries, M.S., 2018. Co-production as deep engagement: Improving and sustaining access to clean water in Ghana and Nigeria. International Journal of Public Sector Management, 31 (1), Pp. 81-96. https://doi.org/10.1108/IJPSM-03-2017-0084
Mekonnen, Y.A., 2023. Evaluation of current and future water demand scenario and hydraulic performance of water distribution systems, a case study for Addis Kidam Town, Ethiopia. Applied Water Science, 13 (40), Pp. 1-17. https://doi.org/10.1007/s13201-022-01843-9
Pragst, F., Stieglitz, K., Runge, H., Runow, K.D., Quig, D., Osborne, R., Runge, C., and Ariki, J., 2017. High concentrations of lead and barium in hair of the rural population caused by water pollution in the Thar Jath oilfields in South Sudan. Forensic Science International, 274, Pp. 99–106, http://dx.doi.org/10.1016/j.forsciint.2016.12.022
PUPR, K., 2007. Water demand projection module and identification of water use fluctuation patterns. pipeline network planning for drinking water transmission and distribution [Modul Proyeksi Kebutuhan Air Dan Identifikasi Pola Fluktuasi Pemakaian Air. Perencanaan Jaringan Pipa Transmisi Dan Distribusi Air Minum], Pp. 1–16.
Qadafi, M., Wulan, D.R., Notodarmojo, S., and Zevi, Y., 2023. Characteristics and treatment methods for peat water as clean water sources: A mini review, Water Cycle, 4, Pp. 60-69, https://doi.org/10.1016/j.watcyc.2023.02.005
Rajasekhar, B., Ramana G.V., and Viswanadh, G.K., 2018. Assessment of nonrevenue-water and its reduction measures in Urban water distribution systems. International Journal of Civil Engineering and Technology, 9 (6), Pp. 1079–1087.
Sahin, O., Siems, R., Richards, R.G., Helfer, F., and Stewart, R.A., 2017. Examining the potential for energy-positive bulk-water infrastructure to provide long-term urban water security: A systems approach. Journal of Cleaner Production, 143, Pp. 557-566, https://doi.org/10.1016/j.jclepro.2016.12.074
Säve-Söderbergh, M., Åkesson, A., Simonsson, M., and Toljander, J., 2020. Endemic gastrointestinal illness and change in raw water source and drinking water production – A population-based prospective study. Environment International, 137, Pp. 105575, https://doi.org/10.1016/j.envint.2020.105575
Shuaib, A.S.M., and Rana, M.M.P., 2020. Assessing water supply for the urban poor in Rajshahi City, Bangladesh. Management of Environmental Quality, 31 (1), Pp. 75-88. https://doi.org/10.1108/MEQ-06-2019-0138
Silva, J.A., and Omaña, M.C.M., 2023. Comparative study of drinking water management in Mexico City and Singapore. Management of Environmental Quality, 34 (2), Pp. 308-330. https://doi 10.1108/MEQ-04-2022-0108
Sun, Y., Liu, N., Shang, J., and Zhang, J., 2017. Sustainable utilization of water resources in China: A system dynamics model. Journal of Cleaner Production, 142, Pp. 613–625. https://doi.org/10.1016/j.jclepro.2016.07.110
Vanella, P., Deschermeier, P., and Wilke, C.B., 2020. An overview of population projections-methodological concepts, international data availability, and use cases. Forecasting, 2 (3), Pp. 346–363, doi:10.3390/forecast2030019
Varady, R.G., Zuniga-Teran, A.A., Garfin, G.M., Martín, F., and Vicuña, S., 2016. Adaptive management and water security in a global context: Definitions; concepts; and examples. Current Opinion in Environmental Sustainability, 21, Pp. 70–77, https://doi.org/10.1016/j.cosust.2016.11.001
Venegas-Quiñones, H.L., Thomasson, M., and Garcia-Chevesich, P.A., 2020. Water scarcity or drought? the cause and solution for the lack of water in Laguna De Aculeo. Water Conservation & Management, 4 (1), Pp. 42-50, DOI: http://doi.org/10.26480/wcm.01.2020.42.50
Werkneh, A.A., and Gebru, S.B., 2023. Development of ecological sanitation approaches for integrated recovery of biogas, nutrients and clean water from domestic wastewater. Resources, Environment and Sustainability, 11, Pp. 100095, https://doi.org/10.1016/j.resenv. 2022.100095
WHO. 2022. Drinking-water n.d. https://www.who.int/news-room/fact-sheets/detail/drinking-water (accessed March 14, 2023).
Wurthmann, K., 2020. Rainwater harvesting system installations required to offset new water demand created by growing populations in Broward and Palm Beach Counties: A dataset for decision making based on numbers of installations, costs, and water and energy savings. Data in Brief, 28, Pp. 105016, https://doi.org/10.1016/j.dib.2019.105016
Yan, B., Jiang, H., Zou, Y., Liu, Y., Mu, R., and Wang, H., 2022. An integrated model for optimal water resources allocation under “3 Redlines” water policy of the upper Hanjiang river basin. Journal of Hydrology: Regional Studies, 42, Pp. 101167, https://doi.org/10.1016/j.ejrh.2022.101167
Yawson, D.O., Mohan, S., Armah, F.A., Ball, T., Mulholland, B., Adu, M.O., and White, P.J., 2020. Virtual water flows under projected climate, land use and population change: the case of U.K. feed barley and meat. Heliyon, 6, Pp. e03127, https://doi.org/10.1016/j.heliyon.2 019.e03127
Yuksel, I., 2015. Water management for sustainable and clean energy in Turkey. Energy Reports, 1, Pp. 129-133, http://dx.doi.org/10.1016/j.egyr.2015.05.001
Zaporozhchenko, V., Tkachuk, A., Tkachuk, T., and Dotsenko, V., 2022. The evaluation of irrigating meliorations efficiency after the change of climatic conditions. Journal of Water and Land Development, 52 (I–III), Pp. 199–204, DOI: 10.24425/jwld.2022.140390
Zlatanovic, S.S., Stojkovic, M., and Mitkovic, M., 2018. Current state and perspective of water management policy in terms of climate change: Case study of the Velika Morava River. International Journal of Climate Change Strategies and Management, 10 (5), Pp. 796-811. https://doi.org/10.1108/IJCCSM-07-2017-0151
| Pages | 01-10 |
| Year | 2024 |
| Issue | 1 |
| Volume | 8 |
