INDICATOR-BASED WATER QUALITY ASSESSMENT OF RENA MEDIUM RESERVOIR, LATUR, MAHARASHTRA
Journal: Water Conservation and Management (WCM)
Author: Gopal Malba Alapure, Parmeshwar Narayan Walse, Bharat Murlidhar Shinde, Omprakash Sugdeo Rajankar
Print ISSN : 2523-5664
Online ISSN : 2523-5672
This is an open access article distributed under the Creative Commons Attribution License CC BY 4.0, which permits unrestricted use, distribution, and reproduction in any medium, provided the original work is properly cited
Doi: 10.26480/wcm.02.2024.205.216
Abstract
 The Rena Medium Reservoir, located in Renapur Taluka, Latur district, Maharashtra, India, was built in 2000 and serves important domestic, agricultural, and industrial purposes. Rena Medium Reservoir and the Rena River’s water quality have suffered over the last ten years due to urbanization, population increase, and intensive agriculture. Using five sample locations in the Riverine Zone, Transition Zone, and Lacustrine Zone, the research study was carried out from December 2021 to May 2022. An analysis was conducted on fifteen parameters using water samples and monthly in-situ data. Mean DO levels during winter were found to be over 8 mg/L, while during summer they were found to be less than 5.7 mg/L, according to phytoplankton analysis. It was discovered that the levels of turbidity exceeded the recommended threshold in every location, and the presence of thermo-tolerant Coli formed, a sign of non-potable water that needs to be properly treated. An additional 34 genera of algae were identified in the study, of which 23.38% were blue-green algae, a sign of contaminated water in the riverine zone and downstream. Investigations into the current state of the Rena Medium Reservoir’s water quality, as well as its seasonal and geographical fluctuations and the impact of human activity on the water, are the goals of this study. In order to improve the management of water resources, other reservoir systems can benefit from the application of the gathered data to the development of mathematical models that forecast changes in water quality brought on by development activities.
Keywords
Rena River, Manjara River, Godavari Basin, Reservoir Water, Water Quality, Rena Medium Reservoir, Water Quality Index
1. INTRODUCTION
India’s water resource projects seek to alleviate the country’s water shortage by supplying water for domestic use, agriculture, electricity production, and industrial expansion. Water needs, mainly for agriculture, have been greatly satisfied by irrigation projects. To prepare water for home and agricultural use, monitoring, analysis, and knowledge of its physical, chemical, biological, and microbiological properties are required. Water intended for one purpose might not be fit for other uses, such as drinking or irrigation. In order to give a specific value for water quality, the Water-Quality Index (WQI) was created in the nineteenth century. The World Bank Document study emphasizes the necessity of better data collection and record-keeping facilities. The purpose of this study is to examine the physical, chemical, biological, and microbiological aspects of Rena Medium Reservoir’s water quality. Concerned authorities use the data gathered to determine sustainable uses for the reservoir and to make decisions about future developments in the Godavari River basin. The gathered information also makes it easier to create mathematical models that will be used to forecast changes in water quality brought on by development projects. These models can then be applied to other reservoir systems, improving the management of water resources.
1.1 Rena Medium Reservoirs
To ensure water supply, the state of Maharashtra has completed 377 major irrigation projects, 128 medium irrigation projects, and thousands of smaller irrigation projects. The Manjra River traverses Maharashtra, Karnataka, Telangana, and Andhra Pradesh. It is a tributary of the Godavari River. Starting in Sawargaon village in Ambajogai, Tehsil, the Rena River empties into the Manjra River at Bhatangali village in Latur district. In 2000, the Rena Reservoir, a medium-sized irrigation project, was built at Bhandarwadi. Renapur Tehsil is one of the fifty villages served by the Rena Medium Reservoir, which has a storage capacity of 11.6 TCM. Basalt is the predominant rock type in the reservoir, which is completely surrounded by black cotton soil. It is extracted directly by the Pandashwar Sugar Factory and has two pump houses on either side. The Rena Medium Reservoir is the only source of water for domestic, irrigation, industrial, and agricultural needs in Renapur Tehsil and the neighboring villages. Nonetheless, worries regarding possible declines in the quality of stored water resulting from fertilizers, nutrient addition, and runoff during rainy seasons impact crops and the diversity of the reservoir.
2. LITERATURE REVIEW
A physico-chemical analysis of the backwater of the Manjra dam in Dhanegaon, Maharashtra, India study revealed that the water at both locations was unfit for human consumption and needed to be treated before use (Akuskar and Gaikwad, 2006). In their 2010 study, M. M. Girkar et al. examined the physico-chemical properties of the Nideban Reservoir in Udgir Tesil, District Latur, Maharashtra, and found that the water quality parameters were within allowable bounds, indicating that the reservoir is suitable for fish culture and agriculture (Girkar et al., 2010). Medium water quality was observed in the September 2013–August 2014 physico-chemical characteristics of Hyderabad’s Osmansagar Lake (Padmaja et al., 2014). Nevertheless, the researchers came to the conclusion that if appropriate action is not taken; the water’s quality may deteriorate, affecting its suitability for drinking. The lake’s elevated algal growth as a result of nutrient presence caused intolerable color and odor levels. The lake’s water quality index dropped to 52.84, which denotes a medium quality. Reversing the significance values and appropriately incorporating expert opinion are two modifications made to the Brown method (Kumar and Alappat, 2009). Using the National Sanitation Foundation Water-Quality Index Method, MPCB (2009–12, 2014–2015) evaluated the quality of river water (MPCB Reports, 2009–12, 2014–2015).
Using the National Sanitation Foundation conducted the Water Quality Index of the Ciambulawung River, Lebakpicung Kampong, Hegarmanah Village, District Cibeber, Banten Province, which is close to the Halimun Salaak National Park (Method et al., 2015). In order to determine WQI, the researchers took into account eight water quality parameters: pH, temperature, turbidity, total solids (TS), nitrates (NO3), biochemical oxygen demand (BOD), dissolved oxygen (DO), temperature, and turbidity. To monitor the quality of surface water, the online WQI calculator was used to calculate the water-quality index (Effendi and Wardiatno, 2015). Taking into account eight water quality parameters, conducted a physico-chemical and biological analysis of the Narmada River in Madhya Pradesh, India (Gupta et al., 2017). Overall, the review of the literature reveals that people are not very interested in learning about the condition of the water they use on a daily basis. Any water body’s water quality is steadily declining as a result of human activity, which also has a direct impact on the body’s biodiversity and contributes to the current water crisis. Every body of water should have its water quality routinely assessed in order to solve these issues.
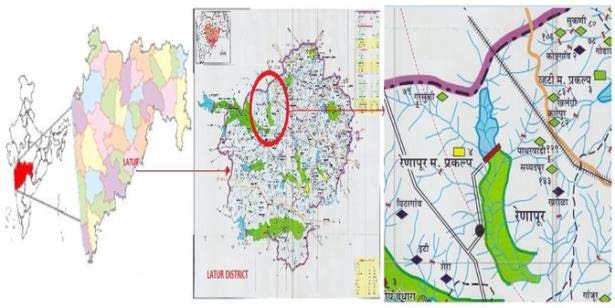
Figure 1: Location of Rena Medium Reservoir
3. MATERIALS AND METHODS
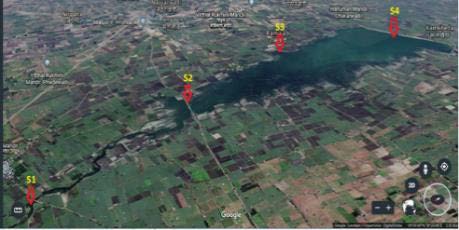
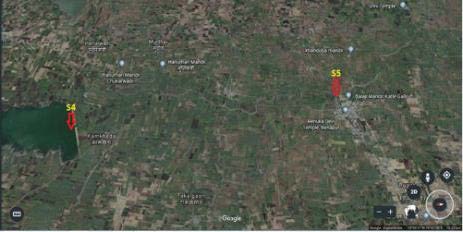
The Latur district of Maharashtra is home to the 16.5 km long Rena Medium Reservoir, which is part of the Rena River. The river starts in Sawargaon village in Ambajogai Tehsil and empties into Rena Medium Reservoir near Bardapur road, which runs between the villages of Phawdewadi and Ramwadi. The Rena Medium Reservoir spillway faces Kamkheda to the south. Five sampling locations were selected in order to examine the effects of human activity on the released water: the first is in the riverine zone at Phawadewadi; the second is in the transition zone at Bardapur Road; the third is in the middle of the reservoir at Ramwadi; the fourth is at the spillway in the lacustrine zone of the reservoir; and the fifth is at the Renapur barrage on the downstream side of the reservoir. In accordance with CW and PRS guidelines, field tests were carried out on the site and water samples for physico-chemical, microbiological, and biological analysis were taken from the surface of Rena Medium Reservoir.
The process of sampling surface water involves testing unstable parameters, field determination, and the timely transportation of collected water samples to the WQAM laboratory, all within a 24-hour timeframe. The study, which examined the winter and summer seasons, ran for six months, from December 2021 to May 2022. Water samples were cleaned with distilled water and placed in a two-litre plastic can. On a planned chart, the analysis work was noted and tracked. Rapid fluctuations in water levels during field experiments have been observed to impact water quality parameters during sampling. In order to prevent errors caused by a delay in time between sampling and analysis, DO fixation was carried out on the spot. 200 ml water samples were collected in sterilized bottles for microbiological analysis, and they were sent to the State Public Health Laboratory in Pune, Maharashtra.
4. METHODOLOGY
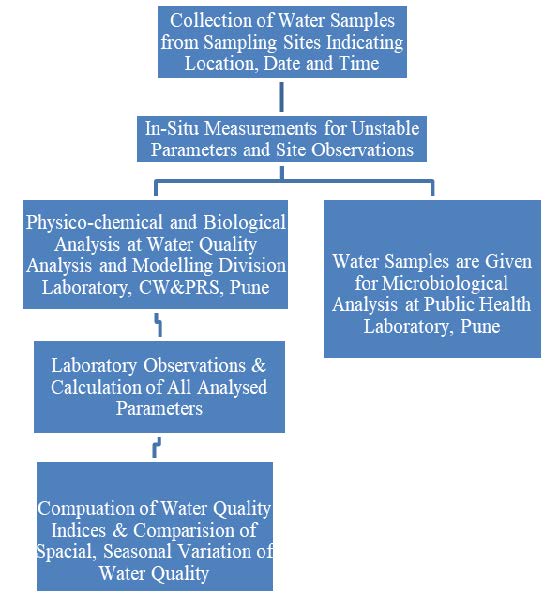
5. RESULTS AND DISCUSSION
The monthly results of water quality parameters are displayed in graphs, showing variations between months. In February 2022, April 2022, and May 2022, water was unavailable at location S5 at the Renapur barrage. The ‘surface’ sample was collected from 0.3 m below surface level, and ‘NA’ abbreviation was used to indicate ‘Water not available’.
5.1 Temperature (T)
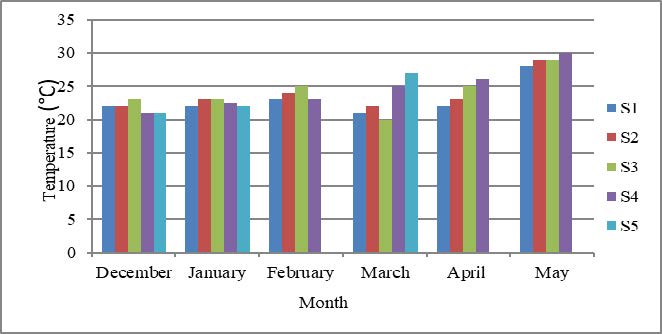
The spatial location, seasonal variations, and time of day all affect a surface water body’s temperature. 10°C to 30°C can be found in tropical and subtropical water bodies. Increased growth and metabolic rates of aquatic organisms, increased rates of chemical reactions and volatilization, decreased solubility of gases, and increased rates of microorganism die-away are all caused by warmer temperatures. When organic pollutants and warm water conditions are present in streams, it can cause eutrophication by depleting oxygen reserves. Temperature swings between 21°C and 30°C are observed in the reservoir’s surface water, with May seeing the biggest increases. Warm temperatures have an impact on the treatment and purification of water, and the temperature of water is important for many industries, including paper and pulp, farms, dairy factories, still mills, rayon production, rice plants, and cooling applications. Pipelines and cooling systems that are exposed to warm water corrode more quickly.
Since they have cold blood, all aquatic animals’ internal temperatures match those of the medium in which they live. Aquatic life’s reproduction and succession depend on seasonal variations in water temperature. Few people know the ideal temperature for the growth and reproduction of aquatic plants and animals. Green algae and noxious blue algae grow best at 25°C to 35°C, while diatoms grow best at 15°C to 25°C? Extended rises in temperature can promote the growth of noxious plants because they affect photosynthesis and respiration.
When summer water temperatures in tropical environments can reach 30°C to 35°C, many species cannot survive or grow, and fish and other aquatic life may perish from heat-related causes. As depicted in figure 4, the Rena Medium Reservoir experienced temperature variations of up to 30°C in the summer and between 21°C and 25°C in the winter. Water levels dropped and evaporation rose abruptly in May 2022, impacting the aquatic biota. The temperature spiked from 4°C to 7°C.
5.2 pH
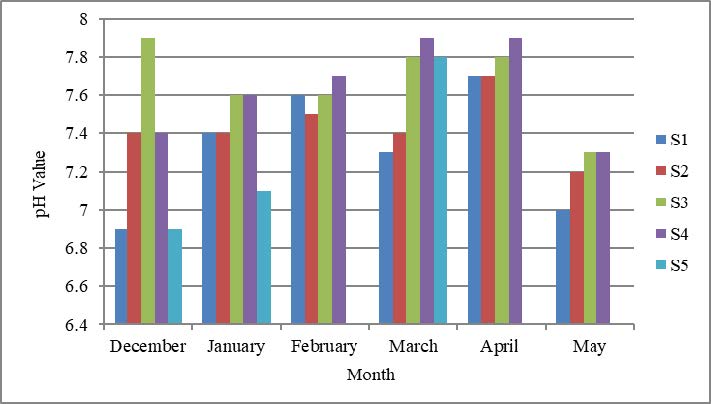
Hydrogen ion concentration, which is measured in moles/L and is inverse of hydrogen ion concentration, determines the pH value of water. A variety of processes, including photosynthetic processes, biochemical oxidation, and mineral conversion, can change the pH of natural water. These processes are influenced by free carbon dioxide, bicarbonates, and carbonate ions. Acids, alkalis, and humus materials—all of which can be released into the water through waste—also have an impact on it. Because pH measurement aids in the regulation of chemical coagulation, disinfection, softening, and corrosion, it is essential to the management of water and wastewater. Concrete and pipes can rust from low pH water. Water has a sour taste at pH 3.9 or lower, which influences pH as well. Large lake surface water undergoes smaller changes, but industrial users are advised to use neutral to slightly alkaline water. Crop type and soil characteristics influence the ideal pH for irrigation. Aqueous environments with extreme pH levels can cause precipitate formation, nutrient solubility changes, and fish kills that happen quickly. They can also change the flora and fauna. Abnormally high or low pH conditions may be the cause of low dissolved oxygen levels.
The pH levels of 5 and 9 have a significant impact on the capacity of fish species to draw oxygen from water. Certain types of plants and animals can grow at pH levels as low as 2.9. While most plants thrive in a pH range of 6 to 7, neutral to slightly alkaline water is necessary for their growth. As per Indian Standards, the pH range for surface water that is most useful is 6.5 to 8.5. In Rena Medium Reservoir, pH values ranged from 6.9 to 7.9 over the course of the study; summertime values were lower, April 2022 values were slightly higher, and May 2022 values dropped sharply because of the severe heat.
5.3 Electric Conductivity
The ability of a solution to conduct current, which is affected by the presence of salts that dissociate into cations and anions, is known as conductivity (EC) in natural water. The EC is measured in mmhos/cm or mS/cm and is expressed at 25°C. Since different ions conduct electricity differently, there can be variations in the correlation between EC and inorganic ions. EC can be used as a proxy for the overall amount of dissolved materials in water samples; TDS, or total dissolved solids, is calculated by multiplying EC by a factor that falls between 0.55 and 0.9. The conductivity of most freshwaters, which ranges from 10 to 1000 mmhos/cm, is occasionally used to detect the influx of seawater into estuarine regions. For many applications of water, such as drinking, irrigation, fishing, and industrial use, the total salt content is critical. The international standard for drinking water EC is 1500 mg/L, while 500 mg/L is advised. Throughout the whole study period, the electric conductivity of the water in Rena Reservoir is measured between 220 and 730 mS/cm, with the exception of location S5. Because of water stagnation brought on by the formation of ponds at location S5, the EC value at Renapur Barrage, or location S5, increased from 650 mS/cm to 2620 mS/cm in January 2022. At the reservoir’s riverine zone (location S1), it was found that the EC progressively rose during the summer.
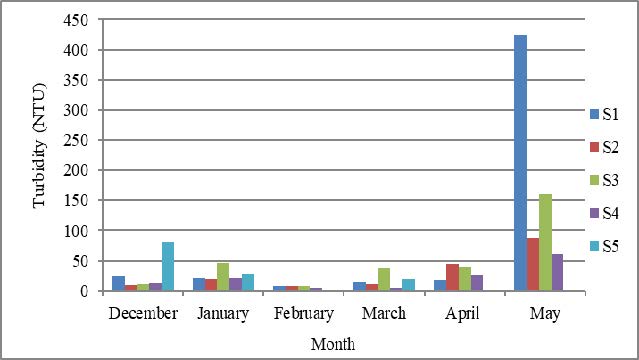
5.4 Turbidity
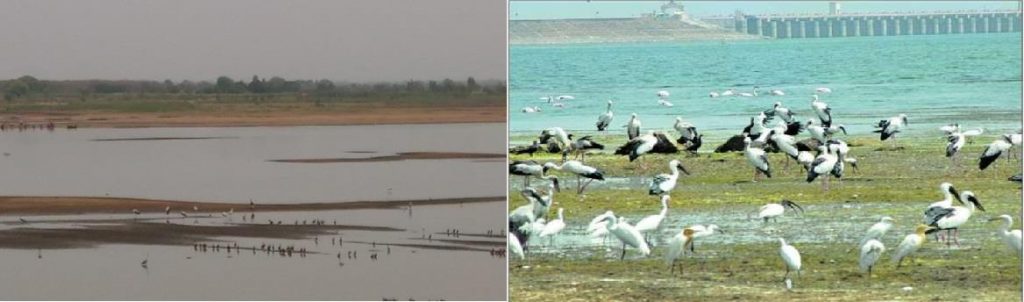
Water turbidity has the potential to harm and deteriorate aquatic life as well as the quality of surface water. Apart from location S1, the turbidity of the Rena Medium Reservoir varied between 5 and 86.6 NTU during the study period. Clean water evaporation and salt buildup caused the turbidity at Phavdevadi in the Rena River to reach 424 NTU in May. There were abrupt drops in water levels because of the high evaporation rate caused by the warm air. Turbidity increased because residue—a build-up of suspended and dissolved matter—was generated. The La-Palma group and flamingos were among the many birds that were seen at the location as the water levels dropped, as figure 8 illustrates.
5.5 Dissolved Oxygen (DO)
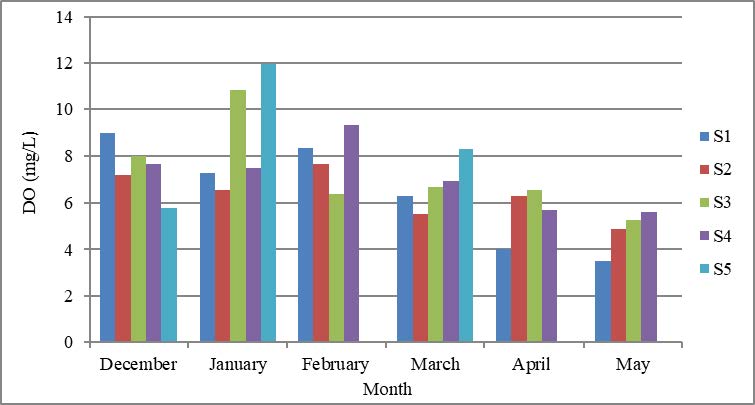
For wastewater to be assimilated and for other biochemical processes that require oxygen, dissolved oxygen is essential. With the exception of anaerobic bacteria and some internal parasites, minimum DO concentration is necessary to maintain healthy aquatic life. For their survival, all freshwater organisms need a sufficient amount of free oxygen. Anaerobic microbial pollution occurs when there is no oxygen present. This can lead to extremely unpleasant conditions such as the build-up of dark sludge and offensive odors. In rivers or reservoirs, low oxygen levels are regarded as dangerous and stressful. The DO concentration needs to stay at 5.0 mg/L or above in order to sustain a diverse fish fauna in good health. Fisheries need a minimum of 4.0 mg/L of DO, according to the CPCB (1992) classification. According to reports, fish that are overly saturated with DO may suffer from dropsy and damage to their gills due to gas bubbles. Except for January 2022 at the S3 and S5 locations, the dissolved oxygen content in Rena Medium Reservoir ranged from 3.5 to 8.9 mg/L. The DO readings at the S3 and S5 locations increased to 10.8 and 11.9 mg/L, respectively, in January 2022. The drop in water levels at these specific locations is the cause of the increase in DO. During sampling, a very tiny depth was noted at location S3.
The highest DO was recorded in January at location S5, at 11.96 mg/L, and the lowest was recorded in May at location S1, at 3.5 mg/L. These observations demonstrate that S1 had DO levels below the recommended limit, indicating a high degree of deoxygenating. It has been noted that the concentration of DO increases in the winter and decreases in the summer.
5.6 Biochemical Oxygen Demand (BOD)
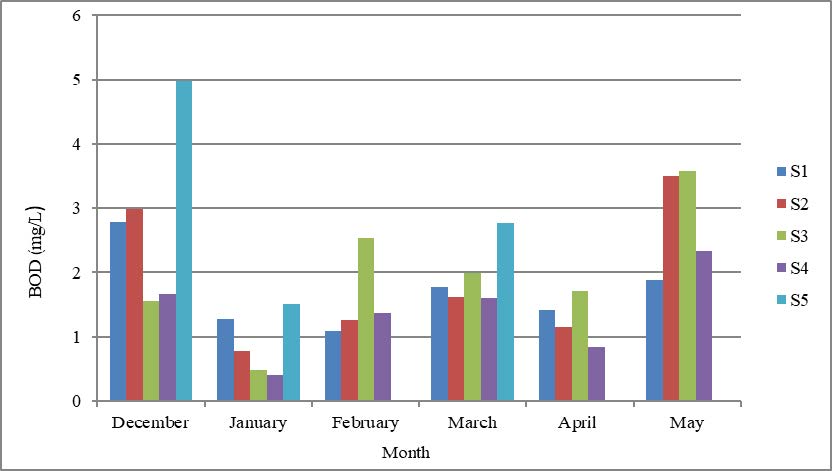
Biochemical conversion of waste organic matter into carbon dioxide and water occurs in an aerobic environment, and microorganisms use this food source. Under carefully regulated laboratory settings, the standard test for biological oxygen demand, or BOD, quantifies the amount of oxygen consumed in the reaction. Unlike the oxygen needed for the oxidation of organic matter, nitrogenous BOD is produced through the biochemical oxidation of ammonia to nitrate. Lower BOD values indicate organic pollution from industrial or municipal wastes, while higher values are typically indicative of unpolluted water, which has less than 2 mg/L. There is a range of 150 to 400 mg/L for BOD in municipal and household waste. Slow-moving streams may have anaerobic conditions if the value is higher than 8 mg/L. Only after stabilizing the majority of organic matter does ammonia oxidation take place. Oxygen concentration in rivers and streams that are contaminated is commonly modeled using the BOD test. Rena Medium Reservoir’s BOD readings during the study period varied from 0.4 to 4.98 mg/L. The presence of artificial ponds and human activity nearby resulted in high BOD values being detected at location S5 in December 2021.
5.7 Calcium (Ca)
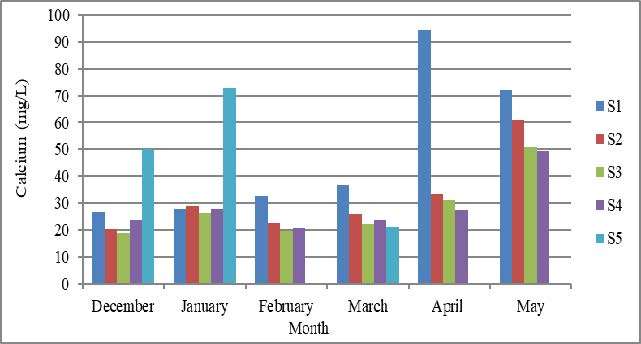
In fresh water, calcium salts and ions are frequently found in concentrations ranging from 0 to several hundred milligrams per litre. The other three major cations are conservative in their chemical reactivity and have minimal biotic requirements, whereas they are primarily influenced by metabolism and biotic requirements. When calcium is stored in reservoirs, calcium carbonate precipitation may cause changes to the pH and hardness of the water. Calcium is necessary for healthy soil tilth, plant growth, and a decrease in chemical toxicity to fish and other aquatic life. In industrial water supplies, calcium can occasionally be desired at moderate concentrations and undesirable at very low or high concentrations. It works well in water because it stops cast iron and steel from corroding, creates a protective coating inside steel pipes and boilers, and stops soap waste from scaling up. The study’s calcium content varied between 18.92 and 94.47 mg/L, with the riverine zone having the highest calcium content. In the reservoir’s riverine zone, the calcium content gradually rose from winter to summer but then declined as a result of increased dilution. May 2022 high temperatures lead to evaporation of clean water and salt build-up in residues with high calcium content, which lowers water levels.
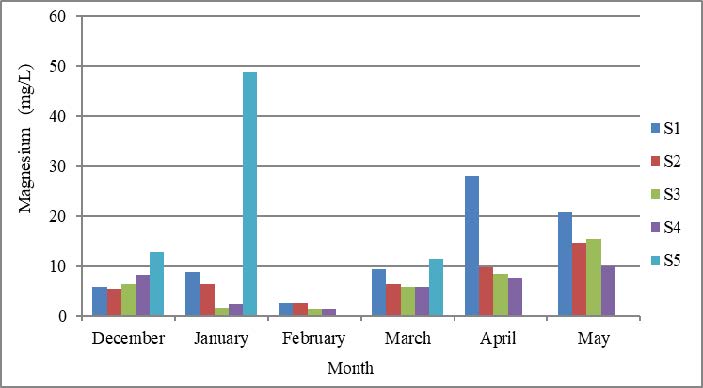
5.8 Magnesium (Mg)
Magnesium can be found widely throughout the crust of the Earth in the forms of carbonate, silicate, sulfate, and chloride. Since it is typically more soluble than calcium, it is a common component of natural water and is therefore less precipitated and required for metabolism. Although it is found in lesser quantities than calcium, magnesium is essential for both plants and animals. Because of its disagreeable taste, it is not regarded as a public health hazard in water. Magnesium concentrations above 125 mg/L may have diuretic and cathartic effects. Although its concentration in surface and ground waters varies greatly, it seldom goes above 30 mg/L. Irrigation water containing cations of magnesium and calcium keeps soil pliable and in good tilth. Soil deficiency in magnesium is more common than in calcium. An essential component of plant photosynthesis is magnesium. Magnesium content ranges from 1.31 to 27.87 mg/L, according to the research study, with location S5 showing the highest value in January 2022. Wintertime sees a first decline in magnesium content, which rises gradually in summer. In the summer, there is a high concentration of magnesium in the riverine zone.
5.9 Carbonate and Bicarbonate
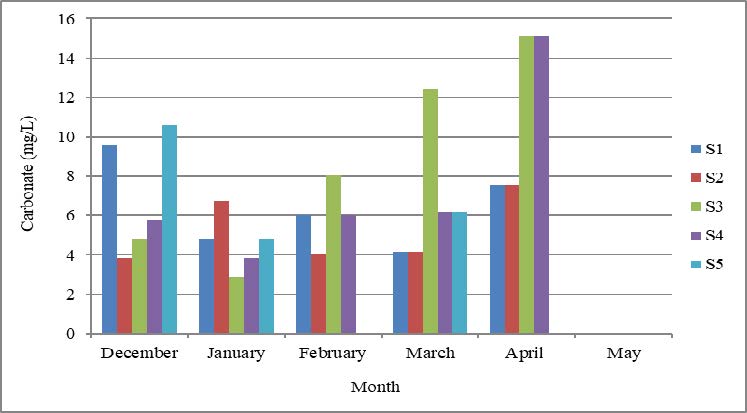
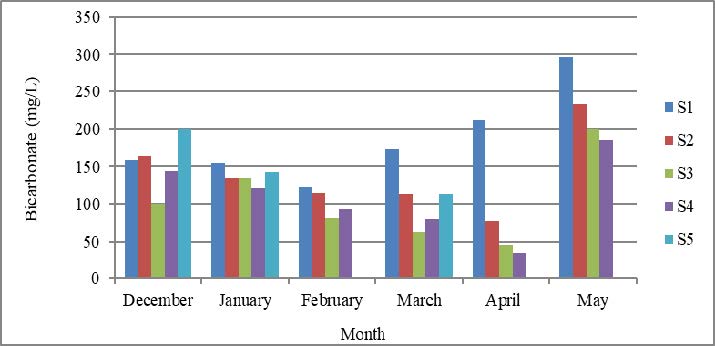
Carbon dioxide is the building block of all living things, including bacteria, and is therefore necessary for organisms. It can build up in pure natural waters and is essential for aquatic life. Temperature, pH, other dissolved solids, bicarbonate addition, and other variables all affect the concentration of carbonates and bicarbonates in both natural and contaminated waters. Bicarbonate is not problematic in irrigation water, but calcium carbonate addition can raise the sodium ratio. Although carbonates and bicarbonates have a buffering effect and can alter pH, they are generally not toxic to fish life. The decrease in bicarbonate content caused by algae can have serious effects on water quality and treatment. Bicarbonate is used by algae either directly or indirectly to raise the pH of water and cause calcium carbonate to precipitate.
The carbonate content and bicarbonate content were measured during the study of Rena Medium Reservoir. The ranges were 3.84 to 15.12 mg/L and 34.54 to 296.22 mg/L, respectively. In May 2022, carbonate is missing from every sample location. Summertime brings quite high levels of carbonate. Compared to other places, the bicarbonate level is extremely high in the riverine zone. As a result, the reservoir’s riverine zone exhibits good diversity. Bicarbonate content in transition is progressively reduced through April and then abruptly increased in May 2022.
5.10 Chlorides
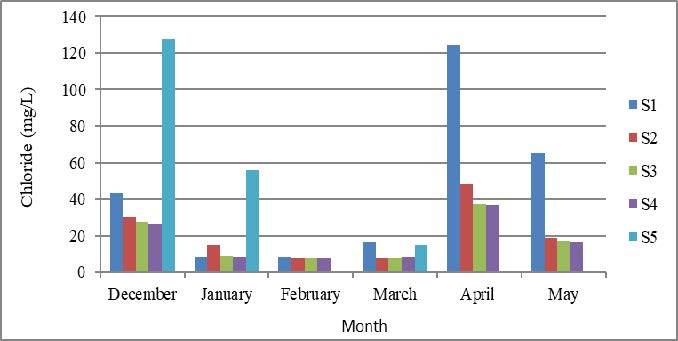
The most common form of chlorine found in nearly all natural waters that is exposed to the atmosphere is chloride. Although it is found in different types of rocks, it is usually found in smaller concentrations than the other main ingredients of natural water. A few examples of exceptions are salts applied to fields or used in agriculture, sewage from people or animals, and industrial effluents. All living things, including plants and animals, need chloride as a bulk anion; it poses no threat to people.
Nevertheless, metal corrosion may result from elevated concentrations. The maximum recommended concentration of 250 mg/L for public use is the limit on chloride concentrations in drinking water, which is based on palatability requirements. Throughout the study period, the reservoir body’s chloride content ranged from 7.65 to 48.04 mg/L. When water emerged in the reservoir’s transition zone, dilution caused the concentration of chloride to drop; in the summer, however, it rose.
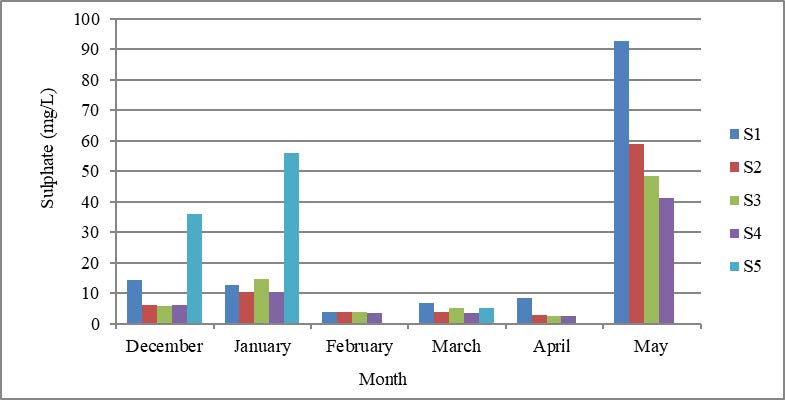
5.11 Sulphate
Surface waters are typically low in sulfate, with the exception of close basins where evaporation raises concentration and areas rich in sulfate ions. Just 1% to 3% of the sulfur in soils is converted each year from organic to inorganic sulfate. The majority of sulfur in soils is found in its organic form. The leaching of fertilizers containing sulfur, weathering of coal and sulphide ore minerals, spillage of sulphur products, combustion of refuse and burning of fossil fuels are some of the sources of sulfur pollution in natural waters. Other sources include mine waters, industrial wastes, home sewage discharge, road drainage, and surface waters from urban areas. During the whole research period, the sulphate concentration is measured between 3.5 and 92.63 mg/L. Because domestic sewage has been added upstream of the sampling site, the sulphate content is high at the S5 location during the pre-winter period. Pre-summer content is lower, and in May it spikes to peak values between 41.4 at S4 and 92.63 at S1, depending on the source. It is during this time that the rate of evaporation is greatest. Sulfate concentrations were rising primarily because of this.
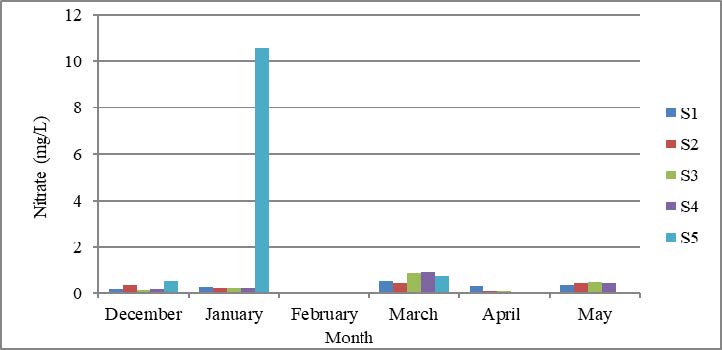
5.12 Nitrate
All living organisms require nitrogen because it is necessary for the synthesis and maintenance of proteins. It is a significant component of the cellular protoplasm of all living things, along with hydrogen, carbon, and phosphorus. In agricultural fields, manure addition, commercial fertilizers, soil mixing and breaking up, and the removal of harvested crops are the main causes of nitrogen loss. Human and animal wastes, especially sewage effluents, are a source of nitrate contamination. When nitrogen is applied to soil as fertilizer or water, it changes and is lost through volatilization or leaching if it is not taken up by microorganisms or plants. The amount of water that percolates through the soil before crops can assimilate the nitrogen determines how much leaching occurs. In natural waters, the concentration of nitrogen compounds varies from zero to more than 100 mg/L in surface water and from zero to 1000 mg/L in ground water. At the S5 location, where water released from reservoirs and crop runoff contributes to higher levels of nitrogen compounds in water, the maximum value of nitrogen compounds is found.
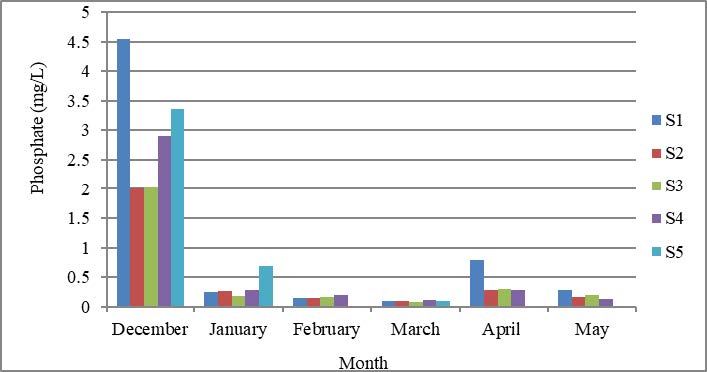
5.13 Phosphate
The primary sources of phosphorous, an uncommon non-living element present in igneous rock and sediments, are rock weathering processes such as erosion and chemical and mechanical weathering. During erosion, it is adsorbed on or into clay particles and partially mobilized as dissolved inorganic phosphate. Because of the modern lifestyle, there is more phosphate in detergents, food processing, and water softening products. Phosphate concentrations are also influenced by other land uses and agriculture, although there is typically little loss from tree-covered areas. There are two types of phosphorus in lake water: organic and soluble. Due to the low solubility of most compounds and the biota’s utilization of phosphorous as nourishment, natural water typically has low phosphorous concentrations. Growing algae use inorganic phosphate because they are effective at extracting phosphate from solutions. Phosphorous is lost to the bottom deposits as well as through flowing water. Phosphorous concentrations in lake sediments are often higher, so phosphate content analysis is required. The growth of phytoplankton is restricted by phosphorous. Rena Medium Reservoir water had high phosphate content in December 2021, ranging from 2 to 4.5 mg/L across all sites. The primary crop in the region, sugarcane, is grown with di-ammonium phosphates (DAP), which have 45% phosphorus by weight. Phosphate concentrations rise during the rainy season as a result of runoff accumulating excess phosphate that is still in the soil. Concentrations drop as the algae in the reservoir begin to grow, and they may even rise after the algae die.
5.14 Faecal (Thermotolerant) Coli form
The quality of water is largely determined by microorganisms, especially when it comes to drinking water. Testing for particular pathogenic organisms is costly and challenging to identify, though. As a result, indicator bacterial presence or absence is frequently used to gauge the sanitary quality of drinking water. The gastrointestinal tract is frequently affected by common illnesses like cholera, dysentery, infectious hepatitis, and typhoid. Additionally, non-pathogenic bacteria are more frequently expelled in everyone’s feces. A portion of these bacteria are unique to feces, and their existence may suggest the presence of both feces and potentially harmful bacteria. As “faecal coli forms,” Escherichia coli and related bacteria are employed as waterborne indicator bacteria. ‘Total coli forms’ are a larger group that start from soil and decomposing plant matter and include these forms. Faecal coli forms typically die at a rate similar to that of most other pathogenic organisms found in contaminated waters. Nonetheless, certain pathogens might endure longer than the forms of faecal coli. By statistically evaluating various volumes of the same samples, the number of coli-form bacteria is calculated and expressed as the most probable number (MPN) per 100 milliliters. In clean rivers, the total number of coliforms can vary from 10 to 100 MPN/100 ml; in contaminated reaches, it can rise to 103 or 106 MPN/100 ml. Between 6 and 1.4X10¹⁴ MPN/100 ml was the observed range for the total count of faecal coli form. The S5 location has the highest faecal coli form values. The upstream of the S5 sampling location receives the addition of Renapur Tehsil sewage. This explains why that location had the highest count. In December 2021, there were also more cases of faecal coli at the S3 location. December 2021 saw the highest water levels in the reservoir. Crops are planted in the field at S3 location, and water is sprayed around the reservoir. The sampling point is at a very shallow depth. The components of the soil are well combined with the water, increasing the amount of faecal coli form at location S3. Over time, the water levels progressively drop as the water is compressed toward the reservoir’s center. The S4 location’s 1.5X10⁸ MPN/100 ml count in February 2022 indicates that the water becomes contaminated and is unfit for human consumption. If the total coliform count in the water is more than 16 MPN/100 ml, it should not be consumed and should be properly treated before usage.
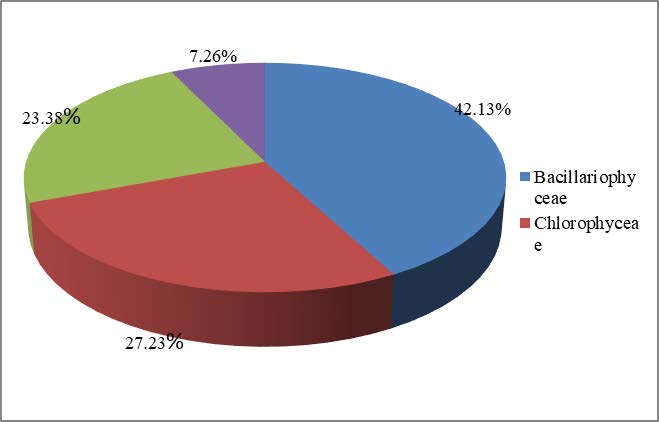
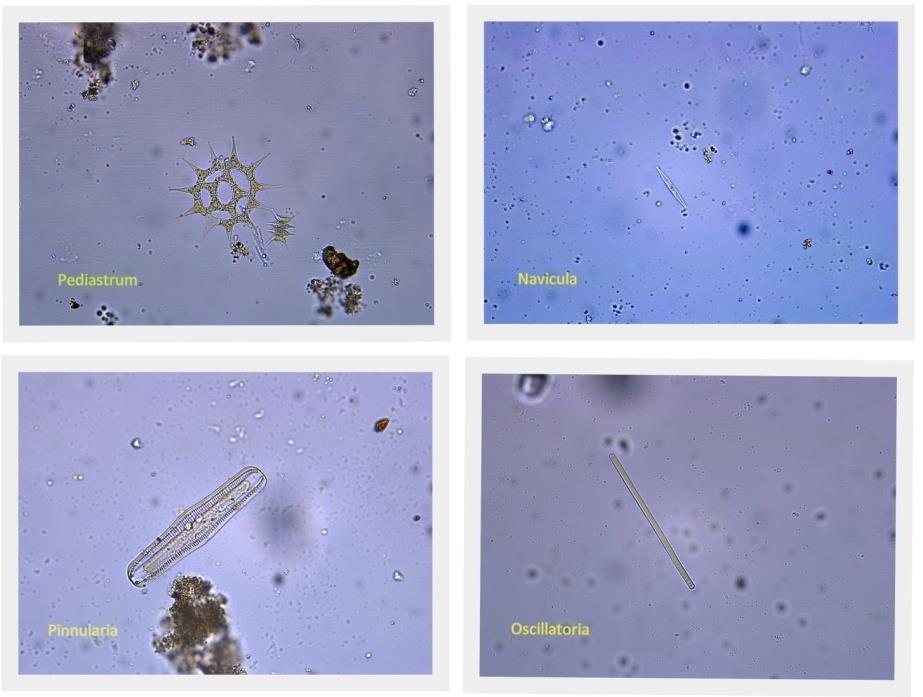
5.15 Biological Parameter: Phytoplankton
The Rena medium reservoir contains records for 34 genera of algae, the majority of which belong to the three main classes of algae: Bacillariophyceae, Chlorophyceae, and Cyanophyceae. Figure 20 displays the group-wise composition as a percentage of the total plankton. Figure 21 depicts the pollution-tolerant algae that can be found in the Rena medium reservoir. In December 2021, pollution-sensitive algae (Cymbella, Cocconeis) were also detected at locations S1 and S2, as well as at location S4 during the summer. According to the findings of studies on algae, the water pollution density in different areas of the Rena reservoir appears to be changing. The relatively high percentage of Cyanophyceae (23.38%) at Rena Reservoir may be a sign of water pollution in the reservoir. Additionally, the Rena medium reservoir’s Pediastrum, Navicula, Pinunlaria, and Oscillatoria presence suggests higher pollution levels in some areas. Diatoms are found to be predominant among phytoplanktons during the pre-winter season, while green algae predominate over other groups during the post-winter and summer seasons.
6. WATER QUALITY INDICES
Water-quality indices are decisive water quality indicators calculated using two methods at each location. The results and comparisons between these indices are discussed in this text.
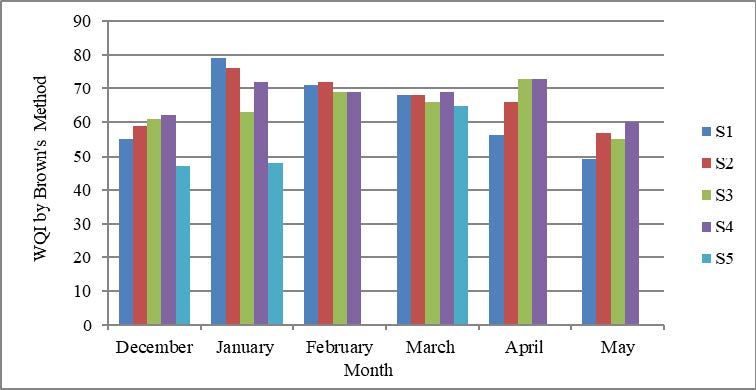
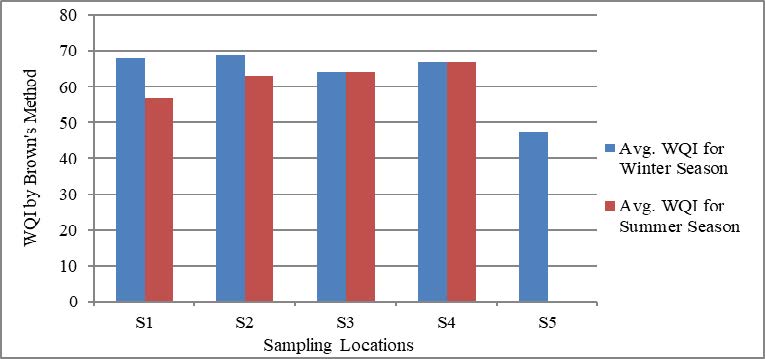
6.1 Water Quality Index Using Brown’s Method (Water Research Center-Online)
Brown’s water-quality index method is used in the research study to determine the water-quality indices at different locations. The water quality varies significantly at different reservoir zones, as indicated by the indices, which range from 47 to 79, representing a “bad to good” range. Reduced values at site S5 (Renapur) signify low-quality water because of town sewage. The riverine zone (Phavdewadi) experiences a decline in water quality in May 2022 as a result of evaporation and nutrient build-up. Due to lower temperatures and dilution, the high range (63 to 79) is observed in January and February of 2022, indicating medium to good water quality. Additionally, the study discovered that wintertime reservoir water quality is superior to summertime quality. The study draws attention to the notable differences in water quality between the various reservoir zones.
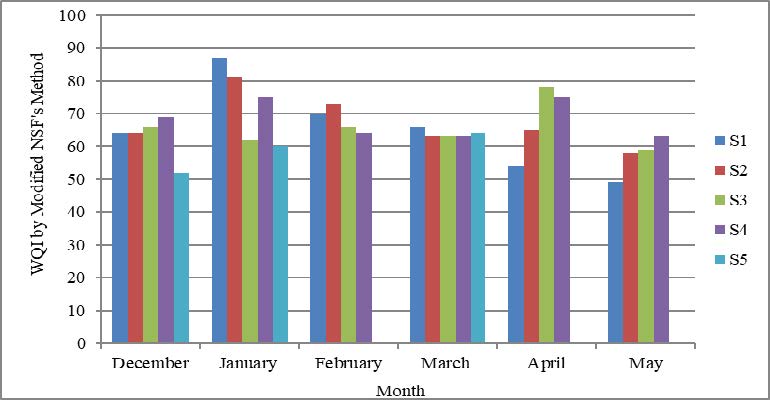
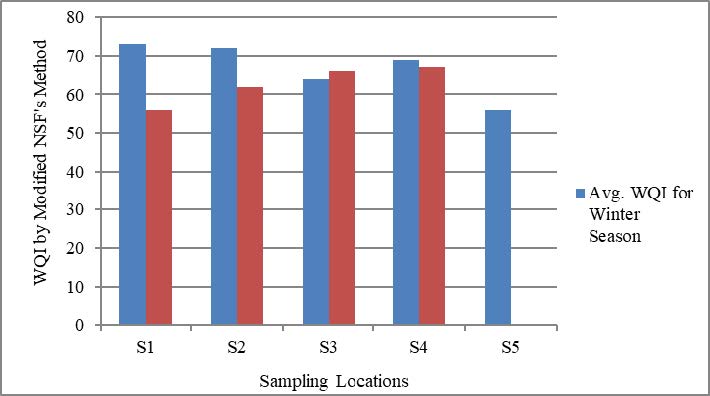
6.2 Water Quality Index by Modified National Sanitation Foundation’s Method
The CPCB calculates the index using four water quality parameters, which vary monthly and seasonally at the sampling sites. With a score between 52 and 87, the water quality is classified as “medium to good” or “good to excellent.” Location S1 records the highest WQI value (87) in January 2022, which falls in the summer. Poor water quality is indicated by the lowest WQI value (49) in May 2022. A seasonal comparison of WQI values reveals that water quality is lower in the summer and higher in the winter. A location’s variation in water quality is indicated by the values of the water-quality index.
The accuracy of assessing water quality was compared between the Modified National Sanitation Foundation method and the National Sanitation Foundation’s water-quality index method. Since Brown’s method takes into account a larger range of water quality parameters than Modified NSF’s method, which only takes into account four, Brown’s method is more accurate. With the exception of pH, DO, fecal coli form, and turbidity, the Modified NSF’s WQI method should be used to evaluate the overall water quality of a particular water body.
Furthermore, the Modified NSF WQI method may not be appropriate for determining water quality if parameters such as temperature, BOD, phosphate, nitrate, and total solids are predominant. In order to assess the water quality status in water bodies with greater accuracy, alternative techniques for calculating the water-quality index are required.
7. CONCLUSION
The objective of the research study is to evaluate the Rena medium reservoir’s water quality through the analysis of multiple parameters, including physical, chemical, biological, and microbiological factors. temperature, pH, turbidity, conductivity, fecal coli form, DO, BOD, calcium, magnesium, carbonate, bicarbonate, chloride, sulphate, phosphate, nitrate, and phytoplankton are among the sixteen water quality parameters that are taken into account in this study. The Brown’s or NSF’s method requires eight parameters, whereas the Modified NSF’s method only requires four. The outcome demonstrates that, in comparison to the reservoir’s water body, the riverine zone and downstream side have extremely poor water quality. Physical characteristics like length, uneven shoreline features, and shallow water zones have an impact on the reservoir’s biological productivity. Seasons differ greatly in the number and diversity of species present, and the reservoir is better suited for the growth of fish and other fauna due to the rich growth of phytoplankton. All locations have pollution-tolerant algae, which suggest that water pollution is rising. Faecal coli form results show that the water is not potable and needs to be treated before use. The Rena medium reservoir exhibits the following zones of dominance in terms of water quality: the Lacustrine Zone, Transition Zone, and Riverine Zone.
REFERENCES
- Akuskar, S. K., Gaikwad, A. V., 2006. Physico-chemical analysis of Manjra dam back water of Manjra River at Dhanegaon, Maharashtra, India. Ecology, Environment and Conservation, 12(1): Pp. 73-74. http:// www. Enviro biotechjournals. com/ article_abstract. php?aid =3021&iid=112&jid=3
- Ansari, K., Hemke, N. M., 2013. Water-quality index for assessment of water samples of different zones in Chandrapur city.’ ‘International Journal of Engineering Research and Applications (IJERA) ISSN: 248-9622, 3(3), Pp. 233-237.https://www.ijera .com/pages/v3-no3.html
- BIS 2012. (Bureau of Indian Standards) 10500). Specification for Drinking Water. Indian Standards Institution, New Delhi, Pp.339-343. https: //www. google. com/ search?q=BIS+ (Bureau+of+Indian+Standards)+10500%2C +2012.+ Specification+for+Drinking +Water. +Indian +Standards+ Institution% 2C+New+ Delhi%2C+ pp+339-343. &oq=BIS+ (Bureau+of+Indian +Standards)+10500%2C+2012. + Specification +for +Drinking+Water.+I ndian+ Standards +Institution% 2C+New+ Delhi%2C+pp+339-343.&aqs=chrome.. 69i5 7.1473j0j15 and sourceid = chrome and ie=UTF-8&safe=active&ssui=on
- Brown R. M., McLelland N. J., Deininger R. A., Tozer R.G., 1970. A Water-Quality Index Do We Dare? Water and Sewage Works 117(10), Pp 339-343.
- Burnsoon, B., 1938. Seasonal Temperature Variation in Relation to Water Treatment. Jpur. A.W.W.A., 30, 793.
- Carins,J.Jr.,1956. Effects of increased temperature on Aquatic Organisms. Industrial Wastes, 1, Pp. 4.CWPRS Report No. 3919, 2000-2002, Field investigations and laboratory analysis for assessment of water quality of Panshet and Ujjani reservoir.
- Dubuqua, Lowa., Welch, P.S., 1952. In: Limnology. Publ: Mc-Graw Hill Book Co. Inc., New York.
- Effendi, H., and Wardiatno, Y., 2015. Water quality status of Ciambulawung River, Banten Province, based on pollution index and NSF-WQI. Procedia Environmental Sciences, Elsevier B. V., 24, Pp. 228-237. https://www .Sciencedirect .com/science /article/pii/ S1878029615000985
- Ewaid, S. H., Abed, S. A., 2017. Water-quality index for Al-Gharraf River, Southern Iraq. Egyptian Journal of Aquatic Research, National Institute of Oceaangraphy and Fisheries.’ https://doi.org/10.1016/j.ejar.2017.03.001
- Girkar, M. M., Sutar V. B., TandaleA. T. and Kunjir S. N., 2009-2010. ‘Assessment of the physico-chemical parameters of Nideban reservoir, Udgir, district Latur’. ‘The Asian Journal of Animal Science’, Volume 12: Issue 2; December, 2017: Pp. 111-116. https://www.i-scholar.in/index.php/Ajas/article/view/165745
- Gupta, N., Pandey, P., and Hussain, J., 2017. Effect of physic-chemical and biological parameters on the water quality of river water of Narmada, Madhya Pradesh, India.Water Science, Volume 31, no.1, Pp. 11-23. https://doi.org /10.1016/ j.wsj. 2017.03.002
- Hussain, S., Mane V., Surendra T. and Farooqui M., 2012. ‘Variation in physico-chemical quality parameters of Manjra dam water Dist. Beed (M S) India. Journal of Advanced Scientific Research’, 3(3), Pp. 34-36. https://www.Researchgate. net/ publication /305706053_Variation_in_Physico-chemical_ quality_ parameters_ of_Manjara_Dam_Water
- Klein, L., 1959. River Pollution- Chemical Analysis. Publ: Academic Press, Inc., N.Y.
- Kumar, D., Alappat B. J., 2009. NSF water-quality index: Does it represent the expert’s opinion?’ Practice Periodical of Hazardous, Toxic Radioactive Waste Management, 13 (January), Pp. 75-79. https://ascelibrary .org/doi/ abs/ 10.1061 /%28ASCE%291090-025X%28 2009%2913%3A1%2875%29
- Laws, E. A., 1981. Aquatic Pollution. Publ: John Wiley and Sons, New York. Pp: 266-281.
- Lund, J.W.G., 1965. The Ecology of Fresh Water Plankton’. Biological Reviews, 40, Pp. 231-293.
- Maharashtra Pollution Control Board Report, 2014-2015. Evaluation of river water quality, Chapter 4, Manjra River.
- Padmaja, K., Jyotsna Cherukuri, M., Anji Reddy, 2016. Seasonal Variations of Water Quality Index of Osmansagar Lake in Hyderabad City -A Case Study’. IOSR: Journal of Environmental Science, Toxicology and Food Technology (IOSR-JESTFT) e-ISSN: 2319-2402, p- ISSN: 2319-2399.Volume 10, Issue 5 Ver. I, May. 2016), Pp. 75-78. https://www.iosrjournals.org/iosr-jestft/papers/vol10-issue5/Version-1/ L100 5017578 .pdf
- Prescott, G. W., 1970. The Fresh Water Algae, WM.C. Brown Company Publishers.
| Pages | 205-216 |
| Year | 2024 |
| Issue | 2 |
| Volume | 8 |
