KINETIC STUDY OF THE PHOTOCATALYTIC DEGRADATION OF ATRAZINE OVER COPPER OXIDE NANOPARTICLES
Journal: Water Conservation and Management (WCM)
Author: Sulaiman O. Adewuyi, Dosu Malomo, Simphiwe M. Nelana, Michael J. Klink, Olushola S. Ayanda
Print ISSN : 2523-5664
Online ISSN : 2523-5672
This is an open access article distributed under the Creative Commons Attribution License CC BY 4.0, which permits unrestricted use, distribution, and reproduction in any medium, provided the original work is properly cited
Doi: 10.26480/wcm.03.2024.274.283
Abstract
 In this study, the kinetics of degradation of atrazine (ATZ) in the presence copper oxide nanoparticles (CuO NPs) under ultraviolet light irradiation was investigated. The CuO NPs was characterized and the different operating parameters of photodegradation such as the initial concentration of ATZ, irradiation time, amount of catalyst and pH were investigated. The scanning electron microscopy (SEM) showed that the CuO NPs were spherical in nature, the particles tend to cluster, forming a random aggregate. TGA-DTA revealed weight loss regions that provide valuable insights to the thermal behaviour and properties of the CuO NPs, FTIR peaks were ascribed to the stretching vibration of copper oxide (Cu-O) bonds, the particle size distribution of CuO NPs revealed diverse range of particle sizes present in the sample and the surface area exhibited by CuO NPs was 138.145 m2/g. Photocatalytic treatment method, showed that the ATZ was broken down by CuO-mediated photocatalysis after 60 minutes of exposure, yielding degradation rates of 85.5% and 68.8% for ATZ concentrations of 6.25 mg/L and 100 mg/L, respectively. With kc equal to 3.315 mg/L/min and KLH equal to 3.68 x 10⁻² L/mg, the treatment approach adhered to the Langmuir–Hinshelwood kinetic model. Pesticide-contaminated wastewater might therefore be successfully cleaned up by photodegrading ATZ using CuO NPs as a catalyst.
Keywords
copper oxide nanoparticles, atrazine, photodegradation, kinetics, wastewater treatment
1. INTRODUCTION
A common application of atrazine (ATZ), also known as 2-chloro-4-ethylamino-6-isopropylamino-1, 3, 5-triazine is the management of various grassy and broad-leaf weeds in maize areas. Additionally, it is used as an agricultural herbicide on trees, horticulture, and products like sorghum. ATZ penetrates plants through their leaves and roots, where it blocks electron transport to prevent photosynthesis (Adewuyi et al., 2024). Because of its low cost and efficiency, it was the herbicide that was used the most extensively worldwide. However, the immune system, hormones, and even some congenital disabilities have all been connected to ATZ. Despite being a widely used pesticide for a while, ATZ was outlawed in the EU in 2004 and in 2009, the EPA re-evaluated it and gave it the go-ahead after praising it for its capacity to break down quickly in soil. ATZ have been detected in America’s drinking water, according to PAN analysis using data from the US Department of Agriculture; these numbers suggest that very little break-down is taking place, thus, ATZ has been the subject of intense debate.
The USEPA has designated ATZ as a priority chemical for potential groundwater contamination of the 83 pesticides evaluated in Agriculture Canada’s priority scheme for potential groundwater contaminants (Health Canada 1993). The European Commission has designated ATZ as one of the 33 priorities with an estimated annual usage of 34 to 36 million kilograms, making it the second most used herbicide in the United States (Kiely et al., 2004). ATZ is also one of the most challenging poisons to remove from water (Jatoi et al., 2021). It is 28-33 mg/L soluble in water at 20 °C and absorbs light at a wavelength of 223 nm from the far ultraviolet range (Azenha et al., 2003). In some water, ATZ has been found to linger for up to 4 years (ATSDR, 2003). According to a research on Lake Michigan, its half-life has been calculated to be up to 14 years in surface water (Kannan et al., 2006). It has been claimed that ATZ can linger in groundwater for up to 20 years (Spalding et al., 2003).
Significant study has been done and is still being done on the toxicological effects of the herbicide on animals, aquatic life, and humans due to ATZ’s persistence and ubiquity in various media, but more particularly in surface and ground waters. ATZ has been linked to the development of reproductive and developmental defects in amphibians as well as behavioral changes in fish (Takacs et al., 2002). It has been linked to a number of human malignancies, including non-Hodgkin’s lymphoma, stomach, prostate, and breast cancers. ATZ has been demonstrated to have acute toxicological effects on a variety of animals, including the inhibition of the release of luteinizing hormone (LH) and prolactin in a dose-dependent manner in both Long- Evans hooded and Sprague-Dawley female rats (Cooper et al., 2000).
Additionally, persistent toxicological effects, such as cardiopathy in Beagle canines, have been reported (Office of Environmental Health Hazard Assessment, 1999). Male Fisher-344 rats’ mammary gland tumors are just one example of the many rat carcinogenic impacts (Kass et al., 2020). A high propensity for endocrine disruption in the bull frog, which is acutely toxic to aquatic life, suggests that its adrenal system is extremely vulnerable to this substance. Several studies showed the herbicide’s long-term toxicological effects on aquatic life, including behavioral changes and non-reversible cell lysis of the kidneys in freshwater molluscs (Rosés et al., 1999), and altering aquatic flora community structures by substituting sensitive species with more tolerant ones. Numerous studies have connected ATZ exposure in humans to a variety of anomalies, including prenatal and reproductive abnormalities, preterm birth and intrauterine growth retardation (Sadeghnia et al., 2022).
It is crucial to treat the ATZ in contaminated water or wastewater, thus, the aim of the study is to learn more about ATZ photocatalysis employing copper oxide nanoparticles (CuO NPs) as the photocatalyst. The objectives of the study are to conduct a detailed characterization of CuO NPs photocatalyst, to examine how operating parameters affect the photodegration progress of ATZ and to investigate the kinetics and mechanism of photodegradation of ATZ. Photocatalytic reaction is a novel approach to counter water pollution, wherein the target pollutant is broken down by the catalyst in conjunction with the photon from the light source.
2. MATERIALS AND METHODS
2.1 Chemical reagents
Copper (II) oxide nanopowder, < 50 nm and atrazine standard, (2-Chloro-4-ethylamino-6-isopropylamino-1,3,5-triazine) were obtained from Sigma Aldrich. Other chemical and reagents include ethanol, sodium hydroxide and hydrochloric acid. Distilled water was used for all analytical preparations.
2.2 Characterization of copper oxide nanoparticles
The scanning electron microscope – energy dispersive X-ray spectroscopy (SEM-EDS) Phenon Prox model was used to carry out the morphology analysis. Fourier transform infra-red spectroscopy (FTIR) was used to determine the functional group present in CuO NPs. Other types of characterization are thermogravimetric analysis – differential thermal analysis (TGA-DTA), Brunauer, Emmett, and Teller (BET) and particle size analysis.
2.3 Photocatalysis of atrazine
At 254 nm wavelength, ultraviolet (UV) light was used to photodegrade aqueous ATZ in a photocatalytic reactor at room temperature (Altendji and Hamoudi, 2023). A combination of 25 mL of ATZ solution and catalyst was rapidly mixed for 5 to 60 minutes of UV light irradiation in the dark, and to extract the solid phase, the aliquots were sampled and filtered. A maximum wavelength of 220 nm was used to detect the ATZ content using a Shimadzu UV-1650 PC (Assaker and Rima, 2012). The efficiency of photodegradation (%) was obtained using Equation 1.
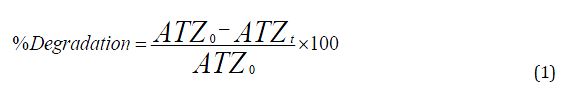
where ATZ0 and ATZt are the initial and final concentration of ATZ, respectively.
3. RESULTS AND DISCUSSION
3.1 SEM analysis of copper oxide nanoparticles
The scanning electron microscopy (SEM) is an influential analytical method employed for the examination of CuO surface morphology and composition. Its central aim is to furnish in-depth insights into the topographical attributes, elemental constitution, and additional distinctive properties of the sample. Figure 1a represent the SEM image of the CuO NPs used in this study. It could be observed from the figure that the CuO NPs were spherical in nature. These particles tend to cluster, forming a random agglomerate/aggregate. This work is in close agreement with other study (Amaliyah et al., 2020; Mali et al., 2019).
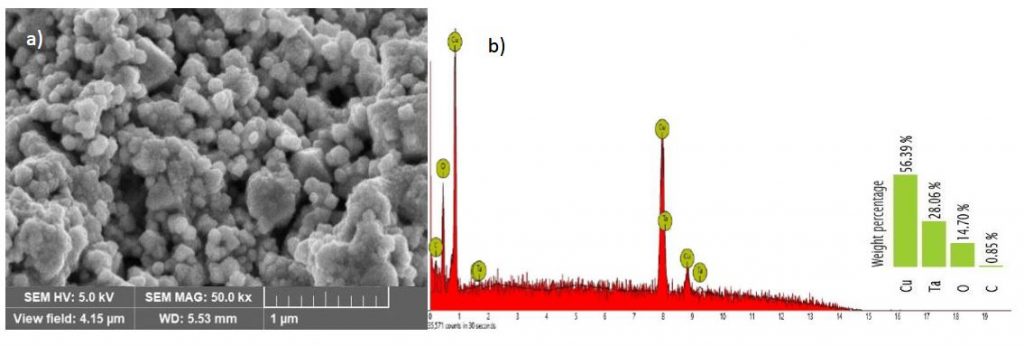
Energy dispersive x-ray spectroscopy (EDS) was used in conjunction with SEM to provide valuable information about the elemental composition of CuO NPs. Figure 1b is the EDS spectrum of CuO nanoparticles. The figure show the qualitative relative abundance of elements present in the analysed CuO NPs. Based on Figure 1b, four elements were detected in the CuO NPs. These elements are copper (Cu), tantalum (Ta), Oxygen (O) and carbon (C). It is obvious from the figure that the most dominating element in the analysed sample is Cu. The percentages by weight of the elemental Cu, Ta, O and C are 56.39%, 28.06%, 14.70% and 0.85%, respectively. A group researcher also reported CuO NPs synthesized using Piper retrofractum Vahl extract as bioreductor and capping agent to contain elements such as e Cu, O and C (Amaliyah et al., 2020). Other elements such as phosphorus, calcium, chlorine, sulphur, potassium and terbium also co-existed at trace level.
3.2 Thermogravimetric analysis of copper oxide nanoparticles
The primary purpose of TGA-DTA analysis is to elucidate the thermal event and transition that materials undergo. TGA quantifies changes in the mass as a function of temperature or time, making it invaluable for uncovering weight loss phenomena like dehydration, decomposition, sublimation, or combustion. Meanwhile, DTA offers insights into endothermic and exothermic reactions, shedding light on phase transitions, melting, crystallization, and chemical reactions. Different categories of materials including nano particles and composites had been previously characterized by TGA –DTA (Rajamohan et al., 2022). The TGA-DTA analysis of CuO NPs, as illustrated in Figure 2 revealed several noteworthy weight loss regions that provide valuable insights to the thermal behaviour and properties of the CuO NPs similar to the report of on the synthesis and characterization of thermally spherical CuO NPs (Tamaekong et al., 2014). The initial weight loss, occurring between 44oC and 47oC, is indicative of the removal of adsorbed moisture, the evaporation of residual solvents, or the elimination of surface impurities from the CuO NPs. This weight loss is clearly observed in the TGA curve, and the corresponding endothermic peak in the DTA curve around 45oC further supports this observation. The endothermic nature of this peak suggests that it represents an energy-absorbing process, likely associated with desorption and surface cleansing. A subsequent weight loss range, extending from 358oC to 420oC, is indicative of the potential degradation or decomposition of organic residues or contaminants present in the nanoparticles. The continuous decrease in weight during this range implies a thermal event leading to the elimination or transformation of specific constituents.
The DTA curve shows no prominent peak in this region, suggesting that this weight loss is primarily due to decomposition rather than a significant energy exchange with the surroundings. Between 486oC and 500oC, another weight loss interval is observed, indicating further decomposition or removal of less stable compounds or impurities within the CuO NPs. The absence of a distinct DTA peak in this region implies that the process is mainly exothermic but might not be associated with a strong heat-releasing reaction.
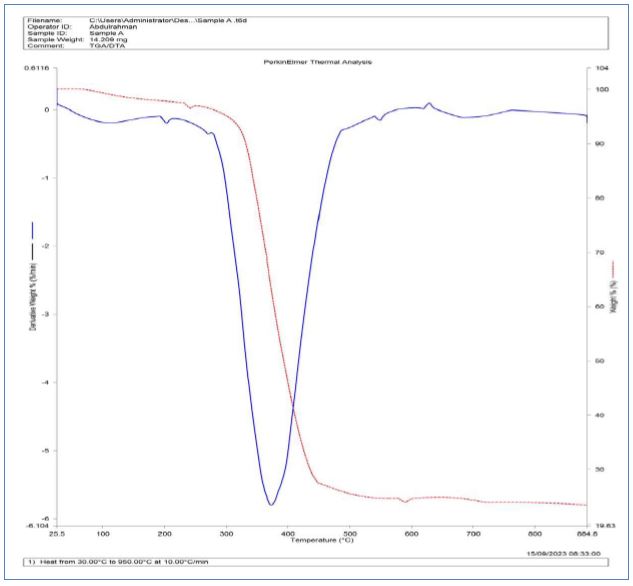
From 500oC to 624oC, the weight remains relatively constant in the TGA curve, indicating thermal stability. During this phase, the material appears to endure without significant decomposition or volatilization, as supported by the absence of prominent peaks in the DTA curve. This suggests that the CuO NPs maintain their structural integrity within this temperature range. The most striking observation is the sharp decline in weight loss, commencing at around 640oC, as evident in the TGA curve. The corresponding exothermic peak at approximately 54oC in the DTA curve suggests an energy-releasing process following the initial weight loss. This change in the rate of weight loss indicates a major thermal event, likely corresponding to the decomposition of CuO into its constituent elements, copper and oxygen, or the liberation of oxygen gas.
This significant weight loss event signifies a fundamental alteration in the composition or structure of the CuO NPs. The DTA curve further supports the TGA data by showing endothermic and exothermic peaks that align with the observed weight loss regions. The endothermic peak around 46oC correlates with the initial weight loss, confirming that it is indeed an energy-absorbing process. Subsequently, the exothermic peak around 55oC suggests an energy-releasing reaction, indicating a potential chemical transformation or interaction following the removal of adsorbed moisture and volatile impurities. A distinct endothermic peak between 194oC and 196oC is indicative of heat absorption during this temperature range. This peak may signify a phase transition or the absorption of energy during a transformation process, such as melting or decomposition. The minor exothermic event around 636oC and the significant exothermic process occurring between 679oC to 789oC in the DTA curve correspond to the weight loss events observed in the TGA data. These exothermic peaks indicate energy-releasing processes, which could be related to chemical reactions or transformations within the CuO NPs (Rajamohan et al., 2022).
3.3 Fourier transform infrared spectroscopy of copper oxide nanoparticles
Figure 3 illustrates the FTIR spectrum of CuO NPs, which was recorded at room temperature and encompasses the wavenumber range of 400 – 4000 cm-1. Within this spectrum, fifteen (15) distinctive peaks are discernible. These specific bands are observed at wavenumbers of 700.73 cm-1, 752.92cm-1, 849.83 cm-1, 946.74 cm-1, 995.19 cm-1, 1077.20 cm-1, 1151.74 cm-1, 1252.38 cm-1, 1364.20 cm-1, 1416.38 cm-1, 1651.21 cm-1, 2027.67 cm-1, 2217.76 cm-1, 2933.41 cm-1, and 3250.23 cm-1.
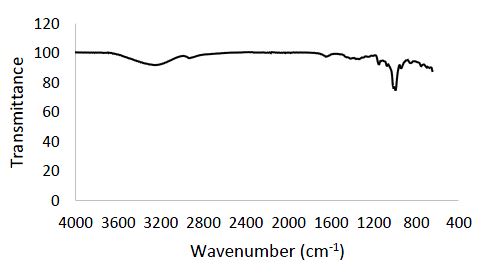
Among these peaks, those occurring at 700.73 cm-1, 752.92 cm-1, 849.83 cm-1, 946.74 cm-1, 995.19 cm-1, 1077.20 cm-1, 1151.74 cm-1, 1252.38 cm-1, and 1364.20 cm-1 are ascribed to the stretching vibration of copper oxide (Cu-O) bonds. It’s noteworthy that the peak at 1416.38 cm-1, also corresponding to the copper oxide (Cu-O) stretching vibration, aligns with findings in the literature (Dehaj and Mohiabadi, 2019). The stretching vibration of Cu-O bonds is a characteristic feature of copper oxide nanoparticles and is used to confirm the presence of copper oxide in the sample. Additionally, the peaks located at 1651.21 cm-1, 2027.67 cm-1, 2217.76 cm-1, and 2933.41 cm-1 are associated with C=C stretching vibration, O-H stretching vibration, C-H stretching vibration, and another C-H stretching vibration, respectively. While these functional groups aren’t directly attributed to copper oxide, their presence in the sample could result from impurities or other compounds (Nzilu et al., 2023). Lastly, the peak at 3250.23 cm-1 is assigned to the O-H stretching vibration, which may signify the presence of water or hydroxyl groups in the sample3.4 Brunauer, Emmett, and Teller (BET) and particle size analyses of copper oxide nanoparticles
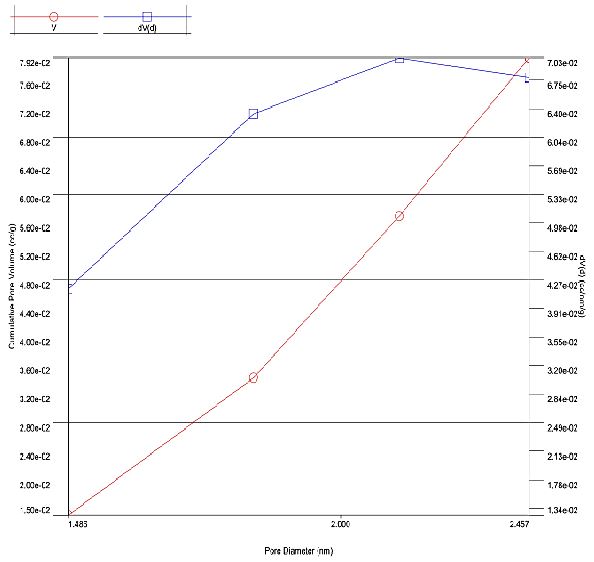
CuO NPs exhibited a surface area of 138.145 m2/g which is by far greater than the CuO NPs (31.8240 m²/g) reported (Rajamohan et al., 2022). The Figure 4 shows the BJH cumulative pore distribution of CuO NPs. The CuO NPs displayed a pore volume of 0.079 cc/g as against 0.255223 m3/g reported for CuO NPs synthesized using apple peel extract under microwave irradiation by (Rajamohan et al., 2022). The CuO NPs have a pore diameter of 2.132 nm.
The Figure 5 illustrates the particle size distribution analysis of CuO NPs, covering a size range from 0.4 to 10000 nm. This distribution graph provides valuable insights into the diversity of CuO particle sizes present in the sample. The distribution begins with smaller particles at 0.4 nm, and as particle size increases, the corresponding intensity values, representing the relative abundance of particles within specific size ranges, exhibit fluctuations. To determine the mean particle size in this distribution, the z-average diameter was employed. Similar parameter was employed in the particle size characterization of copper nanoparticles synthesized via electroreduction process (Raja et al., 2008). The z-average is a significant parameter for characterizing the distribution’s mean size. It takes into consideration both particle size and intensity, providing a weighted average based on the distribution of intensities.
The z-average is an important metric for characterizing the central tendency of particle sizes within the distribution. In this case, the z-average particle size for CuO nanopowder is estimated at 71.49 nm. The mean size of 71.49 obtained in this work is lower than the 86 nm obtained for CuO NPs from Cu (NO3)2 through wet chemical precipitation method (Narayan et al., 2018). The distribution curve primarily appears unimodal, indicating the presence of a dominant mode in the particle size distribution. However, smaller peaks or variations in intensity can be observed at other size ranges, implying the existence of particles within those categories. Further analysis of the CuO NPs particle size distribution reveals the presence of three prominent peaks with varying intensities. Multiple distribution peaks were also observed by (Raja et al., 2008). The first peak is characterized by a z-average particle size of 75.64 nm, making it the most abundant particle population within the sample, with an intensity of 80.7%. This indicates that a substantial portion of CuO particles falls within this specific size range. The moderate standard deviation of 37.29 nm for this peak suggests a degree of variability in particle sizes within this mode.
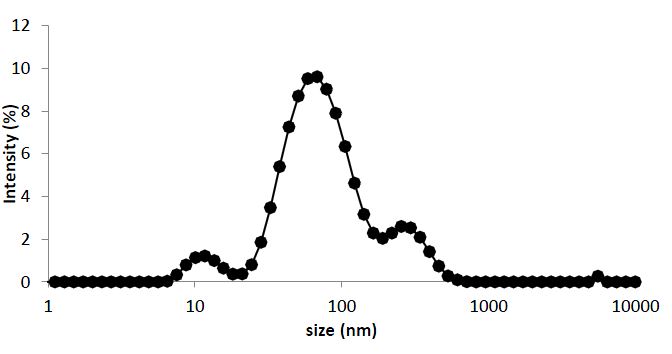
Moving to the second peak, it exhibits a z-average particle size of 293 nm and an intensity of 13.7%. This peak represents a population of larger CuO particles. The higher standard deviation of 86.18 nm within this peak indicates a broader size distribution and greater variability among the larger particles. Finally, the third peak is characterized by a z-average particle size of 11.89 nm and an intensity of 5.4%. This peak corresponds to a population of very small CuO particles. The exceptionally low standard deviation of 2.86 nm within this peak suggests that particles are tightly clustered around this mean size, indicating a high degree of uniformity among the very small particles. In summary, the particle size distribution analysis of CuO NPs reveals a diverse range of particle sizes present in the sample. The z-average diameter provides an overall mean size estimate. While the distribution appears unimodal with a dominant peak, the presence of smaller peaks at other size ranges highlights the heterogeneity of CuO particles within the sample, which is of significant importance for various applications across industries.
3.5 Photolysis and photocatalytic studies
3.5.1 Photolysis of atrazine
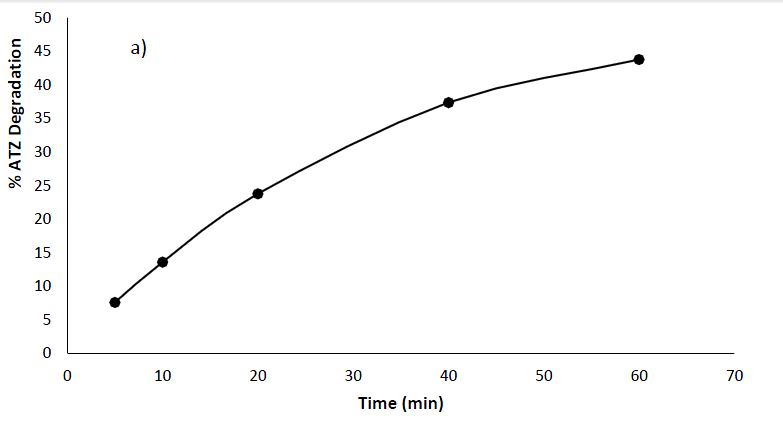
Photolysis of ATZ involves the degradation of atrazine molecules when expose to UV irradiation only. From the Figure 6a, the observed trend indicates an increase in the percentage degradation of ATZ with longer irradiation times. Initially at 5 minutes, the percentage degradation was 7%, which rose to 45% at 60 minutes suggesting that prolonged exposure to UV light enhances the efficiency of ATZ degradation. This aligns with common findings in the field of photolysis, where extended irradiation periods typically lead to increased degradation of target compounds (Vahabirad and Nezamzadeh-Ejhieh, 2023). The influence of irradiation time, along with factors like UV light intensity and the composition of the water matrix, plays a crucial role in determining the extent of ATZ degradation (Liu et al., 2023).
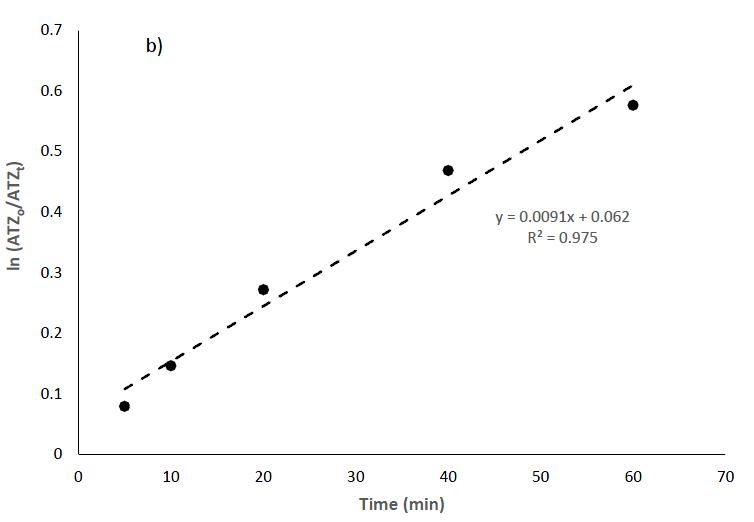
By assuming pseudo-first-order reaction kinetics, Equation 2 was used to deduce the photolytic rate constants (Ayanda et al., 2021).
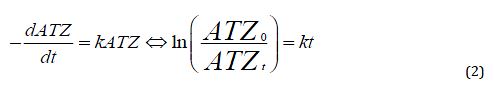
The kinetic plot is shown in Figure 6b. The removal of ATZ best fits the pseudo-first-order kinetics with rate constants k and R2 values of 0.0091 min-1 and 0.9750, respectively.
3.6 Photocatalysis of atrazine by copper oxide nanoparticles
3.6.1 Effect of the irradiation time and copper oxide nanoparticles dosage
The photocatalytic degradation of atrazine using CuO nanoparticles revealed interesting results (Figure 7a). The results revealed a relationship between the dosage of CuO NPs and the photocatalytic degradation of ATZ. At the initial stage of 5 min, the lowest dosage of 0.1 g CuO NPs showed the slightest degradation efficiency of 7.6%, while the highest dosage of 0.5g unveiled a higher degradation of 21.6%. This trend continued throughout the experimental timeline, with the 0.5 g dosage steadily outdoing the lower dosages. For example, at 60 minutes, 0.1 g CuO NPs resulted in 49.4% degradation, whereas 0.5 g CuO NPs achieved a significantly higher degradation efficiency of 70.8%.
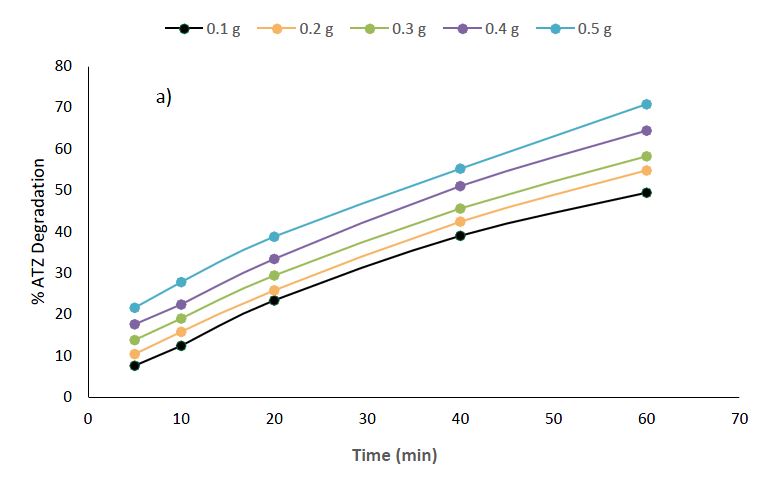
Experimental Condition: Atrazine concentration = 50 mg/L, Volume of solution = 25 ml, Time = 5 – 60min, Nanomaterials dosage = 0.1 – 0.5g.
Several factors interplayed in the photocatalytic reactions. The factors such as catalyst type, light wavelength and intensity, surface area, reactant concentration, temperature, environmental conditions, and electron scavengers’ influence the efficiency of the reaction (Lee et al., 2023). For effective excitation, the choice of catalyst, its morphology, and the matching of light wavelength to the catalyst’s bandgap are critical factors to be considered (Rauf et al., 2024). Reactant concentration, temperature, and environmental conditions impact reaction kinetics, while the presence of oxygen and careful management of electron-hole recombination are essential for optimal performance (Chengula et al., 2024). While higher dosages of CuO NPs may improve the initiation of reactive species and increase the accessibility of active sites, there exists an optimal dosage beyond which accumulation or other phenomena may hinder the photocatalytic process. The observed trend aligns with general principles in photocatalysis, where an optimum catalyst dosage is often crucial for achieving the highest degradation efficiency (Chen et al., 2024).
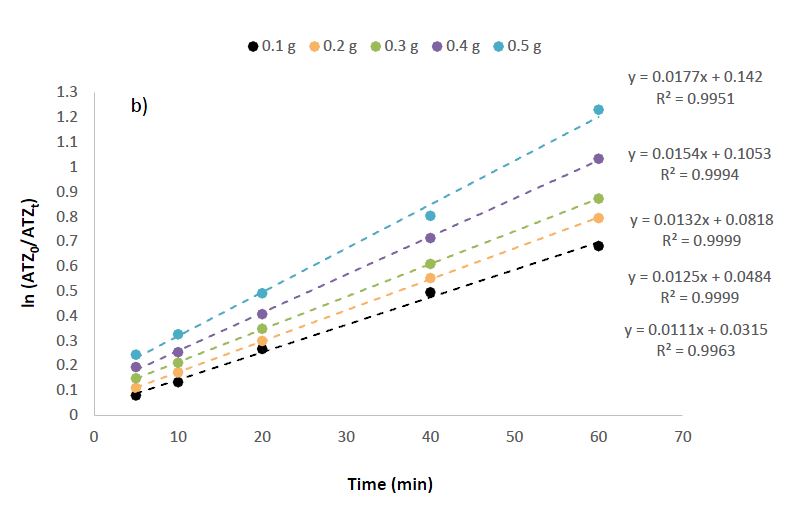
By assuming pseudo-first-order reaction kinetics, Equation 1 was used to deduce the photocatalytic rate constants via a kinetic plot of vs. t (Figure 7b). The removal of ATZ with variation in nanomaterial dosage (0.1-0.5 g) best fits pseudo-first-order kinetics with rate constants k values of 00.0111 min-1, 0.0125 min-1, 0.0132 min-1, 0.0154 min-1 and 0.0177 min-1. The R2 values are 0.9963, 0.9999, 0.9999, 0.9994 and 0.9951, respectively.
3.6.2 Effect of initial concentration of atrazine
In studying the influence of the initial concentration on the photocatalytic degradation of atrazine using CuO NPs, the experimental conditions included ATZ concentrations ranging from 6.25 to 100 mg/L, a fixed solution volume of 25 ml, and a CuO NPs dosage of 0.5g, using irradiation times varying from 5 to 60 minutes. The results unveil a concentration-dependent trend, showing that lower initial concentrations of atrazine lead to increased degradation efficiencies (Figure 8). For example, at the lowest concentration of 6.25 mg/L, the degradation rates are 50.0% at 5 minutes and 85.5% at 60 minutes. As the initial concentration increases to 100 mg/L, the corresponding degradation rates decrease, varying from 32.8% at 5 minutes to 65% at 64.8 minutes. This outcome agrees with common findings in photocatalysis, where higher initial concentrations of contaminants may lead to increased competition for active sites on the catalyst surface, consequently impacting the overall degradation efficiency (Rehan et al., 2024).
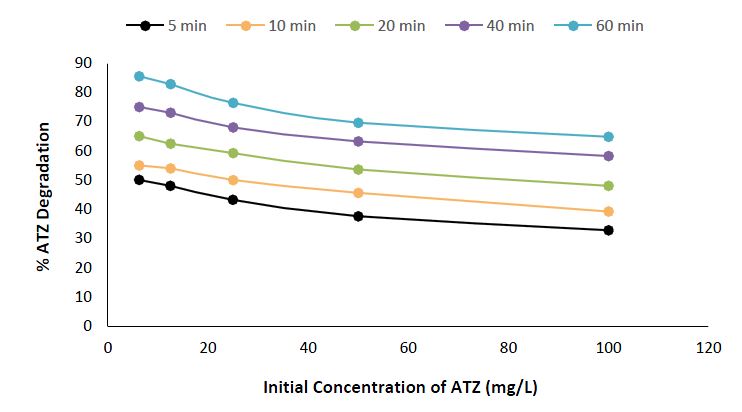
Experimental Condition: Atrazine concentration = 6.25 – 100 mg/L, Volume of solution = 25 ml, Time = 5 – 60min, Nanomaterials dosage = 0.5g.
Based on previous discussions and other scientific findings, the concentration-dependent trend observed in the degradation of ATZ by CuO NPs reveals general trends in photocatalysis (Rajput et al., 2020). It reflects the well-established principle that the catalyst surface and the availability of target molecules and their interactions play crucial roles in determining the overall degradation efficiency (Bogaerts et al., 2020). Furthermore, the results also complement the dosage-dependent trend discussed earlier, where higher CuO NPs dosages were associated with increased degradation efficiencies. Therefore, the combined consideration of initial concentration and catalyst dosage is essential in optimizing photocatalytic systems for efficient pollutant degradation, providing valued understandings for the application and design of such processes in environmental remediation.
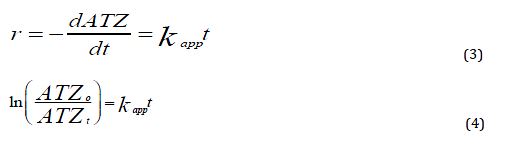
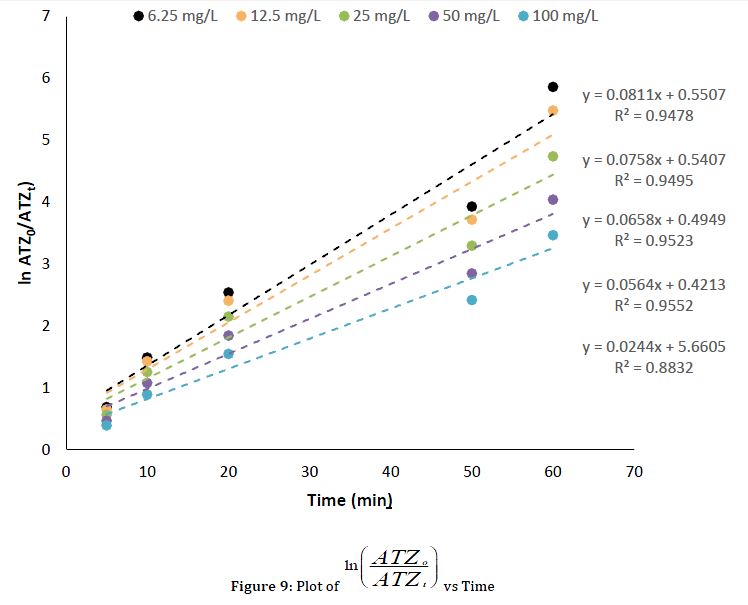
To investigate the mechanism of degradation, the degradation of ATR by UV light catalyzed by CuO NPs was assumed to follow the pseudo-first-order kinetics and depended on the concentration of ATR in the bulk solution (Equation 3). The integration of Equation 3 leads to Equation 4, the kinetic plot of vs. t is presented in Figure 9.
To determine the mechanism of action of the UV light catalyzed by CuO nanoparticles, a heterogeneous kinetic model based on a Langmuir-Hinshelwood (L-H) model was applied (Equation 5) (Ayanda et al., 2022).
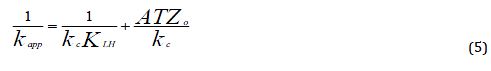
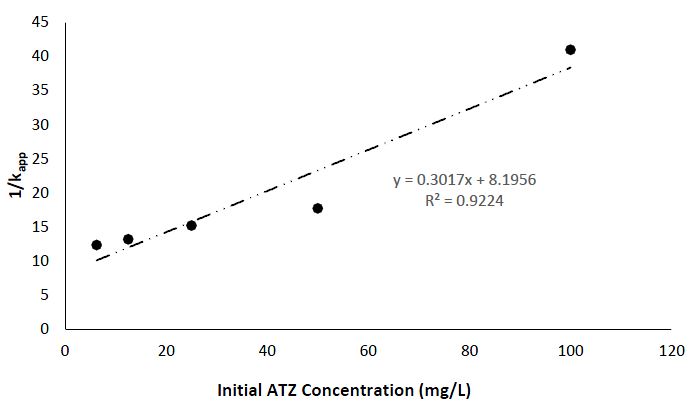
The apparent pseudo-first-order rate constants derived from the Figure 10 (Langmuir–Hinshelwood model) represented by the constants kc (mg/L/min) = 3.315 and KLH (L/mg) = 3.68 x 10⁻² are important in understanding the mechanism of action for the UV light-catalyzed degradation of ATZ, by CuO NPs. The Langmuir–Hinshelwood model is normally used to explain heterogeneous catalytic reactions, whereby the constant obtained give insights of the reaction kinetics and the adsorption of the catalytic process. The value of KLH (Langmuir adsorption constant) provide information of the affinity of the reactant for the catalytic surface, while kc represents the rate constant of the reaction, giving information on the speed of the degradation of the ATZ (Sun, 2015).
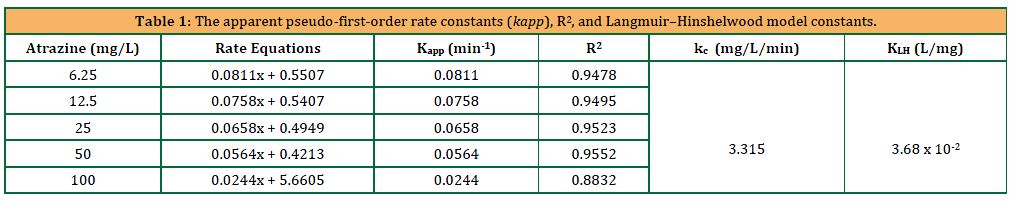
In this study, the obtained constants depicted in Table 1 suggest a relatively substantial adsorption affinity and a high-rate constant, suggesting efficient degradation kinetics and strong interaction between the reactant and CuO NPs. These findings align with the general understanding of the enhanced photocatalytic efficiency of CuO NPs, revealing the potential of CuO NPs as an effective catalyst for UV light-induced degradation of ATZ.
3.6.2 Effect of pH
In investigating the impact of pH on the photocatalytic degradation of ATZ using CuO NPs, the experimental conditions maintained a consistent ATZ concentration of 50 mg/L, a solution volume of 25 ml, and a fixed irradiation time of 60 minutes using a nanomaterial dosage of 0.5g. The results indicate a clear pH-dependent trend in the degradation efficiency (Figure 11). At pH 3, the lowest degradation of 55.8% was observed, suggesting that the acidic states might have reduced the photocatalytic activity of CuO NPs negatively. As the pH increased, a progressive enhancement in degradation efficiency was clear, with pH 5 attain 68.8%, pH 7 – 73.6%, pH 9 – 74.9%, and the highest degradation observed at pH 11 with 76.7%. This pattern aligns with the general understanding of photocatalytic reactions, where the surface charge of the catalyst and the nature of reactive species can be influenced by the pH of the solution (Li et al., 2019).
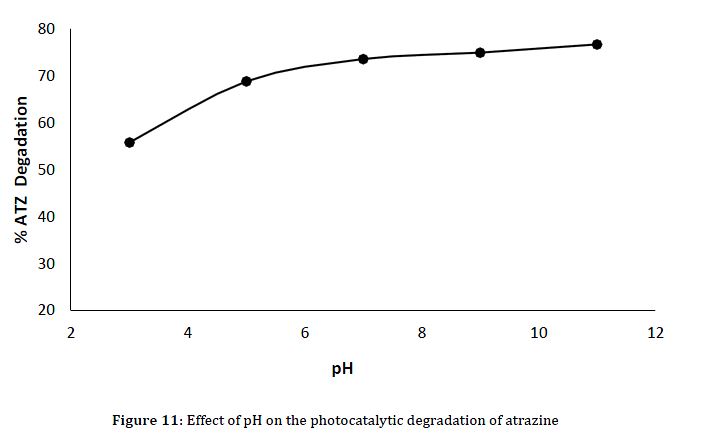
Experimental Condition: Atrazine concentration = 50 mg/L, Volume of solution = 25 ml, Time = 60min, Nanomaterials dosage = 0.5g.
It is prominent that the pH-dependent trend observed in the CuO-mediated photocatalytic degradation of ATZ is regular with broader trends in photocatalysis (Wang et al., 2024). The pH of the reaction medium can affect the surface charge of the catalyst, potentially prompting the adsorption of ATZ and the generation of reactive species (Cao et al., 2021). The optimal pH for photocatalytic reactions often lies in the neutral to slightly basic range, as observed here between pH 7 and pH 11. This result confirms the dosage-dependent trends observed earlier, emphasizing the importance of carefully monitoring experimental conditions to achieve optimal photocatalytic performance. Additionally, these findings contribute to the general understanding of the factors influencing the efficiency of CuO nanomaterials in degrading ATZ, providing valuable information for the design and optimization of photocatalytic systems in water treatment applications.
4. CONCLUSION
ATZ contamination of surface and groundwater has been a persistent issue, and several research have been carried out to eliminate or stop the introduction of this dangerous substance into the water system. This study examined that degradation of ATZ under ultraviolet light irradiation and the use of CuO NPs as photocatalyst. The CuO NP was characterized by the SEM-EDS, FTIR, TGA-DTA, BET and particle size analysis. Throughout the designated periods, the remediation tests showed a dosage-dependent effect on the photocatalytic degradation. The results showed a concentration-dependent trend regarding the influence of the initial concentration of ATZ, demonstrating that greater initial concentrations of ATZ lead to lower degradation efficiencies. A larger percentage of degradation was noted at higher solution pHs, indicating that the photodegration of ATZ in the presence of CuO NP is pH-dependent. When 0.5 g of CuO NP was present and 25 mL of 6.25 mg/L of ATZ was exposed to UV light for 60 minutes, the maximum degradation efficiency of 85.5% was reached. According to this study, ATZ may be successfully cured by using UV light and CuO NP as a photocatalyst, however, the dentification of possible by-products formed after photocatalysis is essential for a comprehensive understanding of the transformation pathway.
REFERENCES
Adewuyi, S.O., Ibigbami, B.T., Mmuoegbulam, A.O., Abimbade, F.S., Abiodun, O.M., Klink, M.J., Nelana, S.M., Malomo, D. and Ayanda, O.S., 2024. Toxicity and health implications of pesticides and the need to remediate pesticide-contaminated wastewater through the advanced oxidation processes. Water Conservation & Management, 8 (1), Pp. 97-108.
Agency for Toxic Substances and Disease Registry (ATSDR), 2003. Toxicological profile for atrazine. U.S. Department of Health and Human Services, Public Health Service. https://atsdr.cdc.gov/unavailable.html
Altendji, K. and Hamoudi, S., 2023. Efficient photocatalytic degradation of aqueous atrazine over graphene-promoted g-C3N4 nanosheets. Catalysis, 13 (9), Pp. 1265.
Amaliyah, S., Pangesti, D.P., Masruri, M., Sabarudin, A. and Sumitro, S.B., 2020. Green synthesis and characterization of copper nanoparticles using Piper retrofractum Vahl extract as bioreductor and capping agent. Heliyon, 6 (8).
Assaker, K., and Rima, J., 2012. Improvement of spectrophotometric method for the determination of atrazine in contaminated water by inducing of Mannich reaction. Journal of Food Research, 1 (4), Pp. 17.
Ayanda, O.S., Aremu, O.H., Akintayo, C.O., Sodeinde, K.O., Igboama, W.N., Oseghe, E.O. and Nelana, S.M., 2021 Sonocatalytic degradation of amoxicillin from aquaculture effluent by zinc oxide nanoparticles. Environmental Nanotechnology, Monitoring and Management 16, Pp. 100513.
Ayanda, O.S., Oforkansi, C.C., Aremu, O.H., Ogunjemiluyi, O.E., Olowoyeye, O.L. and Akintayo, C.O., 2022 Degradation of amido black dye using ultra-violet light catalyzed by iron oxide nanoparticles: kinetics and mechanism of degradation. Catalysis Research, 2 (3), Pp. 1-11.
Azenha, M.E.D.G., Burrows, H.D., Canle, M., Coimbra, R., Fernández, M.I., Garcia, M.V., Peiteado, M.A. and Santaballa, J.A., 2003. Kinetic and mechanistic aspects of the direct photodegradation of atrazine, atraton, ametryn and 2-hydroxyatrazine by 254 nm light in aqueous solution. Journal of Physical Organic Chemistry, 16, Pp. 498-503.
Bogaerts, A., Tu, X., Whitehead, J.C., Centi, G., Lefferts, L., Guaitella, O., Azzolina-Jury, F., Kim, H.H., Murphy, A.B. and Schneider, W.F., 2020. The 2020 plasma catalysis roadmap. Journal of Physics D: Applied Physics, 53 (44), Pp. 443001.
Cao, Y., Jiang, S., Zhang, Y., Xu, J., Qiu, L. and Wang, L., 2021. Investigation into adsorption characteristics and mechanism of atrazine on nano-MgO modified fallen leaf biochar. Journal of Environmental Chemical Engineering, 9 (4), Pp. 105727.
Chen, L., Wang, F., Zhang, J., Wei, H. and Dang, L., 2024. Integrating g-C3N4 nanosheets with MOF-derived porous CoFe2O4 to form an S-scheme heterojunction for efficient pollutant degradation via the synergy of photocatalysis and peroxymonosulfate activation. Environmental Research, 241, Pp. 117653.
Chengula, P.J., Charles, H., Pawar, R.C., and Lee, C.S., 2024. Current trends on dry photocatalytic oxidation technology for BTX removal: Viable light sources and highly efficient photocatalysts. Chemosphere, Pp. 141197.
Cooper, R.L., Stoker, T.E., Tyrey, L., Goldman, J.M., and McElroy, W.K., 2000. Atrazine suppresses LH and prolactin. Toxicological Sciences, 53, Pp. 297-307.
Dehaj, M.S. and Mohiabadi, M.Z., 2019. Experimental study of water-based CuO nanofluid flow in heat pipe solar collector. Journal of Thermal Analysis and Calorimetry, 137, Pp. 2061-2072.
Health Canada, 1993. Guidelines for Canadian drinking water quality: atrazine. Health Protection Branch, Health Canada.
Jatoi, A.S., Hashmi, Z., Adriyani, R., Yuniarto, A., Mazari, S.A., Akhter, F. and Mubarak, N.M., 2021. Recent trends and future challenges of pesticide removal techniques–a comprehensive review. Journal of Environmental Chemical Engineering, 9 (4), Pp. 105571.
Kannan, K., Ridal, J., Struger, J. and Hites, R.A., 2006. Persistent organic pollutants in the great lakes.
Kass, L., Gomez, A.L., and Altamirano, G.A., 2020. Relationship between agrochemical compounds and mammary gland development and breast cancer. Molecular and Cellular Endocrinology, 508, Pp. 110789.
Kiely, T., Donaldson, D., Grube, A., 2004. Pesticide industry sales and usage: 2000 and 2001 market estimates. EPA-733-R-04–001. Washington D. C: U. S. Environmental Protection Agency.
Lee, D.E., Kim, M.K., Danish, M., and Jo, W.K., 2023. State-of-the-art review on photocatalysis for efficient wastewater treatment: Attractive approach in photocatalyst design and parameters affecting the photocatalytic degradation. Catalysis Communications, Pp. 106764.
Li, C., Huang, Y., Dong, X., Sun, Z., Duan, X., Ren, B., Zheng, S. and Dionysiou, D.D., 2019. Highly efficient activation of peroxymonosulfate by natural negatively-charged kaolinite with abundant hydroxyl groups for the degradation of atrazine. Applied Catalysis B: Environmental, 247, Pp. 10-23.
Liu, Y., Li, M., Wu, J., Liu, W., Li, Y., Zhao, F., and Tan, H., 2023. Characterization and novel pathway of atrazine catabolism by Agrobacterium rhizogenes AT13 and its potential for environmental bioremediation. Chemosphere, 319, Pp. 137980.
Mali, S.C., Raj, S., and Trivedi, R., 2019. Biosynthesis of copper oxide nanoparticles using Enicostemma axillare (Lam.) leaf extract. Biochemistry and Biophysics Reports, 20, Pp. 100699.
Narayan, H., Alemu, H., and Jaybhaye, S., 2018. Copper oxide nanoparticles: synthesis and characterization. Proceedings of the AATMC-2018, Kalyan, India, Pp. 43-47.
Nzilu, D.M., Madivoli, E.S., Makhanu, D.S., Wanakai, S.I., Kiprono, G.K., and Kareru, P.G., 2023. Green synthesis of copper oxide nanoparticles and its efficiency in degradation of rifampicin antibiotic. Scientific Reports, 13 (1), Pp. 14030.
Office of Environmental Health Hazard Assessment, 1999. California Environmental Protection Agency. Public health goal for atrazine in drinking water. https://oehha.ca.gov/media/downloads/water /public-health-goal/atrazf.pdf
Raja, M., Subha, J., Ali, F.B., and Ryu, S.H., 2008. Synthesis of copper nanoparticles by electroreduction process. Materials and Manufacturing Processes, 23 (8), Pp. 782-785.
Rajamohan, R., Raorane, C.J., Kim, S.C., and Lee, Y.R., 2022. One pot synthesis of copper oxide nanoparticles for efficient antibacterial activity. Materials, 16 (1), Pp. 217.
Rajput, V., Minkina, T., Ahmed, B., Sushkova, S., Singh, R., Soldatov, M., Laratte, B., Fedorenko, A., Mandzhieva, S. and Blicharska, E., 2020. Interaction of copper-based nanoparticles to soil, terrestrial, and aquatic systems: critical review of the state of the science and future perspectives. Reviews of Environmental Contamination and Toxicology 252, Pp. 51-96.
Rauf, S., Irfan, M., Hayat, A., Alghamdi, M.M., El-Zahhar, A., Ghernaout, D., Al-Hadeethi, Y. and Lv, W., 2024. Recent developments, advances, strategies in heterogeneous photocatalysts for water splitting. Nanoscale Advances, https://doi.org/10.1039/D3NA00442B
Rehan, M., Montaser, A.S., El-Shahat, M., and Abdelhameed, R.M., 2024. Decoration of viscose fibers with silver nanoparticle-based titanium-organic framework for use in environmental applications. Environmental Science and Pollution Research, Pp. 1-22.
Rosés, N., Poquet, M. and Mufloz, I., 1999. Behavioural and histological effects of atrazine on freshwater molluscs (Physa acuta Drap. and Ancylus fiuviatilis Mull. Gastropoda). Journal of Applied Toxicology, 19, Pp. 351-356.
Sadeghnia, H., Shahba, S., Ebrahimzadeh-Bideskan, A., Mohammadi, S., Malvandi, A.M. and Mohammadipour, A., 2022. Atrazine neural and reproductive toxicity. Toxin Reviews, 41 (4), Pp. 1290-1303.
Spalding, R.F., Exner, M.E., Snow, D.D., Cassada, D.A., Burbach, M.E. and Monson, S.J., 2003. Herbicides in ground water beneath Nebraska’s management systems evaluation area. Journal of Environmental Quality, 32, Pp. 92-99.
Takacs, P., Martin, P.A., and Struger, J., 2002. Pesticides in Ontario: a critical assessment of potential toxicity of agricultural products to wildlife, with consideration for endocrine disruption. Volume 2: triazine herbicides, glyphosate and metolachior. Technical report series no. 369. Canadian Wildlife Service, Ontario Region. Burlington, Ontario, Canada.
Tamaekong, N., Liewhiran, C., and Phanichphant, S., 2014. Synthesis of thermally spherical CuO nanoparticles. Journal of Nanomaterials, Pp. 1-5.
Vahabirad, S., and Nezamzadeh-Ejhieh, A., 2023. Evaluation of the photodegradation activity of bismuth oxoiodide/bismuth sub-carbonate nanocatalyst: Experimental design and the mechanism study. Ecotoxicology and Environmental Safety, 263, Pp. 115254.
Wang, S., Yuan, C., Chen, W., Niu, Y., Yan, Y., Li, F. and Jiang, H., 2024. 3D spherical CuO@ g-C3N4 composites activating peroxymonosulfate for high efficient degradation of 2, 4, 6-trichlorophenol: The mechanism of 1O2 generation. Chemical Engineering Journal, 480, Pp. 148050.
| Pages | 274-283 |
| Year | 2024 |
| Issue | 3 |
| Volume | 8 |
