Water Conservation and Management (WCM)

Water Conservation and Management (WCM)

wcm.01.2025.55.60

ENVIRONMENTAL SUSTAINABILITY OF DESALINATION: A CRITICAL REVIEW OF
BRINE TREATMENT CHALLENGES AND MITIGATION STRATEGIES

Journal: Water Conservation and Management (WCM)
Author: Driss Azdem, Jamal Mabrouki, Ghizlane Fahdi, Souad El hajjaji
Print ISSN : 2523-5664
Online ISSN : 2523-5672

This is an open access article distributed under the Creative Commons Attribution License CC BY 4.0, which permits unrestricted use, distribution, and reproduction in any medium, provided the original work is properly cited

Doi: 10.26480/wcm.01.2025.55.60

Abstract

Desalination has become a vital means of producing drinkable water in areas of the world where there is a shortage of water, giving millions of people access to clean water; however, its long-term viability is questioned due to its effects on the environment, especially the concentrated brine it produces, with this review examining the environmental impacts of desalination and brine treatment, focusing on challenges and mitigation strategies for minimizing their ecological footprint, as the production of high-salinity brine, often containing pollutants, poses a significant threat to marine ecosystems due to increased salinity, habitat degradation, and disruption of marine biodiversity, while desalination processes consume considerable energy, contributing to greenhouse gas emissions, and often involve chemicals with adverse environmental consequences, with the review discussing mitigation measures, including advanced brine treatment technologies, energy efficiency improvements, and sustainable desalination practices, ultimately emphasizing the need for a holistic approach to ensure the environmentally responsible implementation of desalination as a water management strategy.

Keywords

Desalination, Brine Disposal, Environmental Impacts, Membrane-based Technologies, Sustainability.

1. INTRODUCTION

Water is a vital component of life on Earth (Singh, 2024), yet the planet’s freshwater resources are scarce in comparison to the vast quantities of saltwater (Ismail, et al., 2024); as the global population continues to expand and water consumption increases, it becomes imperative to develop innovative solutions to ensure an adequate supply of clean water for drinking, agriculture, and industry; desalination has emerged as a promising solution (Azdem et al., 2024), offering a means of transforming saltwater into freshwater (Fahdi et al., 2024), and this technology is currently in use in over 140 countries, providing drinking water to millions of people (Azdem et al., 2024); although desalination is frequently regarded as an environmentally benign solution (Lin et al., 2023), it is important to acknowledge the potential environmental implications associated with any industrial process, one significant concern being the generation of brine, a highly concentrated salt solution (Al-Amoudi et al., 2023) that remains as a by-product of the desalination process; brine is considerably more saline than seawater and may contain harmful chemicals used in the desalination plant (Azdem et al., 2024; Basheir et al., 2024), which could have a detrimental impact on marine life and coastal ecosystems (Sirota et al., 2024); at present, most brine from desalination plants is released directly into the ocean (Porto Pereira et al., 2024), raising significant concerns regarding its effects on marine ecosystems; additionally, desalination is a highly energy-demanding process, predominantly powered by fossil fuels (Mabrouki et al., 2022), and this reliance on non-renewable energy sources exacerbates greenhouse gas emissions and atmospheric pollution, further intensifying the environmental footprint of desalination activities; the environmental effects of desalination can be observed during both the construction of the plants and their ongoing operation (Bencheikh et al., 2020), and the specific impacts of desalination may vary depending on the water source and the location of the plant, but the need for careful management and mitigation strategies remains constant; a number of reviews on the subject have been published to date by (Soliman et al., 2021) which explore the potential environmental effects of desalination facilities on coastal zone ecosystems; a further review paper (Sirota et al., 2024) examined the environmental impact of brine discharge from desalination plants on benthic ecosystems; furthermore, (Abdul Ghani et al., 2021) conducted an investigation into the environmental impact of the Malaysian seawater reverse osmosis (SWRO) plant; more recently, (Bencheikh et al., 2020) studied the negative impacts of desalination brine on marine flora and fauna; existing reviews often overlook the latest advancements in desalination technology, including both commercial and emerging innovations that can be used to treat brine and recover valuable resources like freshwater and salts; additionally, recent and cutting-edge mitigation strategies are often not fully explored; this review aims to bridge this gap by (1) analysing and evaluating the potential environmental impacts of desalination technologies, (2) ranging from brackish water to brine treatment; we will (3) explore the current state of desalination technologies and then delve into their environmental impacts, (4) highlighting mitigation measures that can help minimize these risks; finally, we will (5) discuss our findings and offer perspectives on future directions for the sustainable development of desalination; we utilized the following keywords to conduct a comprehensive search across various databases including Google Scholar, SCOPUS, and Science Direct: “The environmental impact of desalination”, “discharged desalination brine”, “Environmental Impacts and Brine Management”, “environmental impact assessment of desalination plants”, and “Characteristics of desalination brine”; our search yielded a total of 1081 publications on the subject (471 from Google Scholar, 314 from SCOPUS, and 296 from Science Direct); to ensure relevance, we focused on peer-reviewed articles published within the last 20 years (2003-2023), available in full-text and written in English, and removed duplicates, leaving us with 215 unique papers for detailed analysis in our review.

2. CONVENTIONAL DESALINATION TECHNOLOGIES
2.1 Global Trends in Desalination Technologies and Capacities
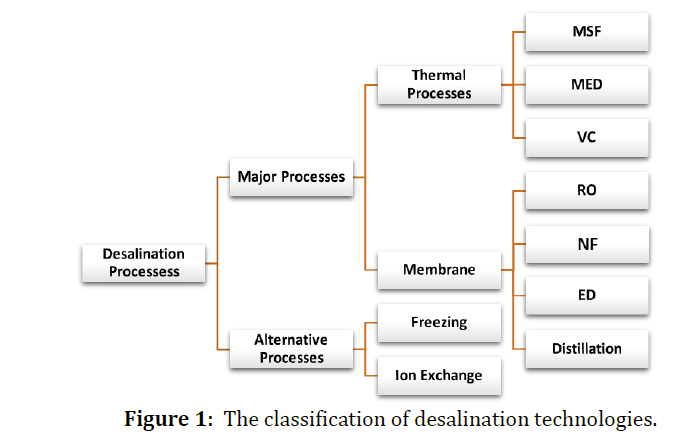
Desalination technologies have evolved significantly and can be divided into two categories (Shalaby et al., 2024) based on their operating principles as shown in Fig.1: thermal-based and membrane-based; thermal-based approaches use heat to achieve separation by distillation or evaporation, mirroring natural water cycles where saline solutions are evaporated and condensed to produce fresh water, with key thermal desalination technologies such as Multi-Effect Distillation (MED) and Multi-Stage Flash Distillation (MSF) being widely recognized for their efficiency in large-scale applications (Tareemi and Sharshir, 2023); on the other hand, membrane-based technologies function without a phase change by utilizing semi-permeable membranes that permit water molecules to pass while blocking salts and other impurities, relying on electrical energy to create the pressure differences required for separation, with the main membrane-based techniques including reverse osmosis (RO), nanofiltration (NF), electrodialysis (ED), and electrodialysis reversal (EDR), each using different filtration and ion exchange mechanisms to purify water (Altıok et al., 2024).

Currently, thermal distillation processes account for approximately 35% of desalination, while reverse osmosis dominates with a share of 63% (Farid et al., 2024), underscoring their key role in meeting global freshwater needs; the total installed desalination capacity worldwide is about 115 million cubic meters per day (Mm³/d) (Bencheikh et al., 2020), of which reverse osmosis (RO) technology accounts for about 88 Mm³/d; recent literature (Bencheikh et al., 2020; Farid et al., 2024) highlights RO as the most important and widely used desalination method, used not only for saline water treatment but also for industrial and potable water production (Bhandari et al., 2023), as shown in Fig.2, which outlines the global use of different desalination methods along with their respective production capacities.

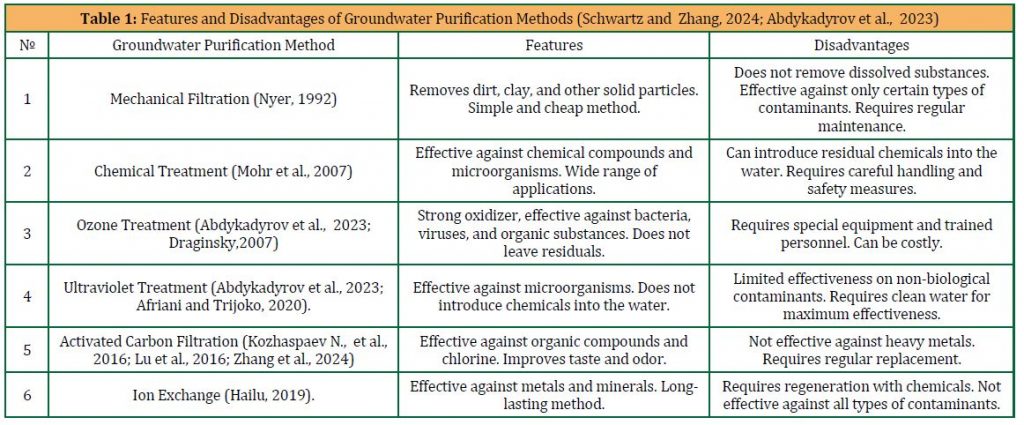
Desalination historically demands substantial energy inputs (Mahmoudi et al., 2023), primarily from fossil fuels, for either thermal or electrical power (Table 1), which incurs high operational expenses and contributes to the release of harmful air pollutants and greenhouse gases into the atmosphere (Wang and Azam, 2024).

2.2 Desalination Technologies In North African Countries
Desalination technologies have been integral to addressing water scarcity in North Africa since the early 1950s (Fattah et al., 2022), albeit in modest scales and capacities initially; the transformative phase commenced in the mid-1970s, particularly in Libya and Algeria, where the burgeoning oil industry necessitated reliable water sources, and rapid advancements in Reverse Osmosis (RO) technology have propelled its widespread adoption across the region; RO stands out as the preferred method due to the region’s favorable water salinity levels (Al-Addous et al., 2024), making it both economically viable and technically feasible for large-scale desalination projects (Sarmiento Barrios et al., 2024) (Fig.3).

3. CONVENTIONAL DESALINATION TECHNOLOGIES
The discharge of brine is recognized as the primary vehicle for environmental impacts (Tu et al., 2024), transporting nearly all liquid waste generated in desalination processes (Akinpelu, 2023), including chemicals used in pre-treatment, corrosion by-products, filter backwash, and concentrated brine from reverse osmosis (RO) desalination (Fattah et al., 2023); this part examines various environmental impacts linked to brine disposal in membrane desalination, highlighting its significance as a major environmental concern.

3.1 Environmental Challenges and Impacts of Membrane-Based
Desalination Processes

One of the most significant challenges currently facing desalination technology is the need to mitigate its environmental impact; the implementation of desalination processes may result in a range of direct and indirect environmental consequences (Nasrollahi et al., 2023), with the environmental impact of membrane-based desalination being influenced by several key components, including the intake of feed water, brine discharge, the desalination mechanism itself, pre-treatment of the feed water, and the energy demands associated with the process (Wang et al., 2024); in particular, brine discharge has been identified as a significant source of environmental impact (Azdem et al., 2024; Sola et al., 2024) due to the corrosive by-products, filter backwash, and chemicals used in pre-treatment that it contains.

3.2 The Effects of Brine Disposal from Membrane-Based Desalination
Brine discharge from desalination operations is widely recognized as the primary waste product in terms of both volume and composition (Rivero-Falcón et al., 2023); the environmental impacts (EIs) of brine on marine ecosystems and aquatic organisms are largely driven by factors such as increased salinity, elevated temperature, pH levels, heavy metal content, and residual chemicals (Tu et al., 2024); numerous EIs studies focus on analyzing brine properties at the point of discharge and after initial mixing with seawater in the mixing zone (Sun et al., 2023; Azdem et al., 2024) to better evaluate its potential effects; recently, Sirota et al. (2024) conducted a thorough study examining the specific impacts of seawater desalination on marine ecosystems and aquatic organisms, while Benchrifa et al. (2022) consolidated various findings from diverse sources, including scientific publications, environmental monitoring data, and environmental impact assessments (EIAs), with a focus on the effects desalination has on ocean ecosystems, particularly with respect to water intake and brine discharge systems; however, the study is limited to marine environmental impacts, excluding other critical aspects like emissions; for a comprehensive assessment of desalination’s environmental consequences, it is essential to consider all stages of the process; this review takes such an approach, addressing these broader issues, as summarized in Figure 4, which highlights the main physical, chemical, and biological impacts of brine discharge on the marine environment in Seawater Reverse Osmosis (SWRO) desalination.

3.3 Greenhouse Gas (GHG) Emissions
Desalination is a highly energy-demanding process (Mabrouki et al., 2022), largely reliant on non-renewable fossil fuels, which contribute to climate change (Shahid et al., 2023); this raises significant concerns about the environmental impact of desalination plants, particularly in terms of energy consumption and greenhouse gas (GHG) emissions; the primary challenge is to reduce the overall energy demand of these facilities, while the second is to transition towards renewable energy sources to lower GHG emissions; presently, many desalination plants still rely heavily on fossil fuels, which release pollutants such as CO, NO, SO, and particulate matter (PM10) into the atmosphere; Figure 5 illustrates the GHG emissions associated with seawater reverse osmosis (SWRO) desalination; according to Xue et al. (2023), SWRO plants powered by natural gas produce roughly 2.75, 2.15, and 1.65 kg-CO2/m³ of water for the steam cycle (Khouya, 2023), internal combustion engine, and combined cycle, respectively; Bencheikh et al. (2020) estimate that these facilities generate around 1.75 kg-CO2/m³ of water based on their global warming potential, while SO2 emissions related to acidification were estimated at about 22 g-SO2/m³; additionally, the carbon footprint of an SWRO plant with a daily production capacity of 0.65 MCM was estimated to range between 2.3 and 2.5 kg-CO2/m³; in a larger study involving 18 desalination plants combining SWRO and brackish water reverse osmosis (BWRO) systems with a combined capacity of 1.600 MCM/day, the total annual carbon emissions were estimated to be approximately 1,150 Kt CO2, equating to about 1.80 kg-CO2/m³.

3.4 Environmental Effects of Brine Disposal from Thermal
Desalination Processes

Thermal desalination systems, such as Multi-Stage Flash (MSF), typically require a much larger volume of input water to produce a specific amount of freshwater due to their lower recovery rates compared to membrane-based techniques (Tareemi and Sharshir, 2023); as noted by Bencheikh et al. (2020), MSF plants have an input-to-output ratio ranging between 9 and 19, with approximately 65% of the intake water being used for cooling purposes; similarly, Multi-Effect Distillation (MED) systems function in a comparable manner but require less water for cooling (Dashputre et al., 2023), leading to challenges like higher seawater usage and the need for larger infrastructure; furthermore, these systems can adversely affect marine ecosystems by increasing the potential for water contamination and trapping marine life within the desalination process; the environmental impacts (EIs) linked to brine disposal from thermal desalination processes largely mirror those seen in membrane-based systems, though some important differences exist (Dashputre et al., 2023); key distinctions arise in factors such as brine temperature, flow rate, and salinity, as thermal desalination systems tend to have lower recovery rates and require cooling, with the brine discharge flow rate in membrane-based systems being about three to five times higher than in thermal systems for comparable production levels (Ibrahim et al., 2023); in terms of salinity, brine from thermal desalination usually ranges between 32 g/L and 45 g/L (Al-Amoudi et al., 2023), which is generally lower than what is observed in Seawater Reverse Osmosis (SWRO) systems; however, the brine released from thermal processes is typically around 5–12°C warmer than the surrounding seawater (Ibrahim et al., 2023), raising the temperature of the surrounding water and reducing dissolved oxygen, which can result in increased mortality rates among marine organisms due to thermal shock (Sirota et al., 2024); furthermore, chemicals used during the pretreatment stage, such as corrosion inhibitors, antifoaming agents, antiscalants, residual biocides, and trace metals, are released into the ocean, potentially harming marine ecosystems and affecting sediment health (Bencheikh et al., 2020); although these chemicals are essential for the smooth operation of desalination plants and maintaining water quality, they also present significant environmental challenges, with traces of these chemicals found in the effluent from Multi-Effect Distillation (MED) and Multi-Stage Flash (MSF) desalination plants, indicating their presence in discharged waters (Poirier et al., 2023; Mehtari et al., 2023).

3.5 Environmental Impacts and Efficiency of Hybrid Desalination Systems
Hybrid desalination systems integrate both membrane-based and thermal-based processes (Gohil et al., 2023), each contributing unique environmental impacts; consequently, the environmental effects (EIs) of hybrid systems are typically the sum of the impacts from each individual process (Yazdani et al., 2023). For instance, Electrodialysis (ED) and Electrodialysis Reversal (EDR) systems employ electrically-driven membranes rather than conventional hydraulic pressure (Vinothkumar et al., 2023), showcasing how various technologies are combined within hybrid systems. Given the well-documented environmental effects of both membrane and thermal desalination techniques, assessing the EIs of hybrid systems is relatively straightforward (Bencheikh et al., 2020), and these impacts are largely determined by three factors: (1) the type of hybridization, whether heterogeneous or homogeneous; (2) the system’s complexity, which can range from bi-hybrid to tri-hybrid configurations; and (3) the specific desalination technologies used. The primary objectives driving the development of hybrid systems—cost reduction, increased efficiency, and enhanced productivity—also align with environmental goals (Shalaby et al., 2023), specifically: (1) reducing energy consumption lowers greenhouse gas emissions, (2) improving recovery rates minimizes both water consumption and waste output, and (3) enhancing operational efficiency decreases the need for chemical pretreatment, thus reducing the release of harmful substances in brine discharge.

3.6 Environmental Considerations for Desalination Facility Intakes
and Outfalls

Regardless of the desalination method used, all plants require intake and outfall systems, with their design and scale tailored to the specific technology in use (Elshaikh et al., 2024). Intakes fall into two main categories:
• Open sea intakes, which include surface and submerged structures located just above the seabed (Nielsen et al., 2024).
• Subsurface intakes, which use infiltration galleries or wells (de Miguel et al., 2023).

Similarly, outfall systems can be open or submerged. The selection of an intake and outfall system depends on factors such as plant size, desalination technique, local hydro-geomorphological features, and environmental impact (Aljohani et al., 2023), all of which significantly affect the overall costs. For instance, desalination plants near power stations often share intake and outfall configurations. The choice of intake system is especially important as it influences seawater pretreatment and overall plant efficiency (de Miguel et al., 2023). However, the introduction of these systems can disrupt marine ecosystems, making the reduction of environmental impact a critical consideration in their design and planning.

3.7 Sustainable Future Prospects for Desalination and Membrane
Technologies

The future development of desalination processes should prioritize sustainability, particularly in membrane-based technologies (Abounahia et al., 2023). Integrating innovative scientific advancements with new system designs has the potential to yield global environmental benefits (Shalaby et al., 2023). To advance desalination technology in a more sustainable and eco-friendly direction, greater emphasis must be placed on green manufacturing processes. Achieving a circular economy in desalination requires the implementation of multiple interconnected, closed-loop systems, ensuring minimal waste and resource reuse. Designing desalination technologies with this in mind is crucial for a sustainable future.

3. CONCLUSION
Water is a vital resource for sustaining life on Earth, with less than 1% of the planet’s water being suitable for drinking. In North African nations, particularly Morocco, desalination has emerged as a crucial solution to address water scarcity driven by arid climates and limited freshwater resources. Morocco has been increasingly relying on desalination to secure water supplies for domestic, agricultural, and industrial purposes, with large-scale projects like the Agadir desalination plant setting an example for sustainable water management in the region.

However, the environmental challenges associated with desalination, especially the discharge of concentrated brine, pose significant risks to marine ecosystems. The increase in salinity, along with chemical pollutants in brine, threatens marine biodiversity and disrupts coastal habitats. Additionally, the energy-intensive nature of desalination contributes to greenhouse gas emissions, further complicating environmental sustainability efforts. This study has critically reviewed the environmental impacts of desalination in North Africa, highlighting the need for effective mitigation strategies such as advanced brine treatment technologies and the adoption of renewable energy sources. While desalination plays an essential role in meeting water demands, particularly in regions like Morocco, addressing its environmental consequences is vital to ensure the long-term sustainability of water resources.

The key findings are as follows:

1. Desalination technologies, particularly reverse osmosis, dominate water production in North Africa due to the region’s favorable water salinity levels.
2. Brine discharge remains a significant environmental challenge, requiring advanced treatment solutions to mitigate its impact on marine ecosystems.
3. A transition towards energy-efficient and renewable-powered desalination plants is essential for reducing the carbon footprint of water production in Morocco and other North African nations.
4. Hybrid systems combining multiple desalination methods show promise in improving recovery efficiency and reducing environmental harm.

In conclusion, while desalination offers a reliable solution to water scarcity in Morocco and North Africa, careful attention must be paid to minimizing its environmental footprint. Sustainable practices and innovative technologies will be crucial in ensuring the long-term viability of desalination as part of the region’s water management strategy.

REFERENCE

  • Abdul Ghani, L., Ali, N. A., Nazaran, I. S., and Hanafiah, M. M., 2021. Environmental performance of small-scale seawater reverse osmosis plant for rural area water supply, Membranes, vol. 11, no 1, 40, 2021.
  • Abounahia, N. M., El-Sayed, A. M. A., Saleem, H., and Zaidi, S. J., 2023. Overview on the progress in produced water desalination by membrane-based technology, Journal of Water Process Engineering, vol. 51, p. 103479, February 2023, doi: 10.1016/j.jwpe.2022.103479.
  • Ai, C., Zhao, L., Song, D., Han, M., Shan, Q., and Liu, S., 2023. Identifying greenhouse gas emission reduction potentials through large-scale photovoltaic-driven seawater desalination, Science of The Total Environment, vol. 857, p. 159402, January 2023, doi: 10.1016/j.scitotenv.2022.159402.
  • Akinpelu, A. A., 2023. Chapter 23 – Brine waste management in desalination industry: a prospective wealth from waste, in Innovation of Food Products in Halal Supply Chain Worldwide, N. N. Ahmad Nizar, S. A. S. Zainal Abidin, et A. Bujang, Eds., Academic Press, 2023, pp. 311-329, doi: 10.1016/B978-0-323-91662-2.00023-5.
  • Al-Addous, M., Bdour, M., Rabaiah, S., Boubakri, A., Schweimanns, N., Barbana, N., and Wellmann, J., 2024. Innovations in Solar-Powered Desalination: A Comprehensive Review of Sustainable Solutions for Water Scarcity in the Middle East and North Africa (MENA) Region, Water, vol. 16, no 13, Art. no 13, January 2024, doi: 10.3390/w16131877.
  • Al-Amoudi, A. S., Ihm, S., Farooque, A. M., Al-Waznani, E. S., and Voutchkov, N., 2023. Dual brine concentration for the beneficial use of two concentrate streams from desalination plant – Concept proposal and pilot plant demonstration, Desalination, vol. 564, p. 116789, October 2023, doi: 10.1016/j.desal.2023.116789.
  • Aljohani, N. S., Kavil, Y. N., Al-Farawati, R. K., Aljohani, N. H., Orif, M. I., Ghandourah, M. A., and Salam, M. A., 2023. The assessment of environmental parameter along the desalination plants in the Kingdom of Saudi Arabia, Open Chemistry, vol. 21, no 1, January 2023, doi: 10.1515/chem-2022-0274.
  • Al-Rawajfeh, A. E., Alzalabieh, E., Al Bazedi, G., Al-Mazaideh, G. M., and Shalayel, M. H. F., 2023. A review on harmful algae blooms in Arabian Gulf: causes and impacts on desalination plants, Desalination and Water Treatment, vol. 290, pp. 46-55, April 2023, doi: 10.5004/dwt.2023.29482.
  • Azdem, D., Mabrouki, J., Moufti, A., Hajjaji, S. E., 2024. Present Situation and Environmental Impact of Seawater Desalination Plants in Morocco, in Technical and Technological Solutions Towards a Sustainable Society and Circular Economy, J. Mabrouki and A. Mourade, Eds., Cham: Springer Nature Switzerland, 2024, pp. 581-592, doi: 10.1007/978-3-031-56292-1_46.
  • Azdem, D., Mabrouki, J., and El Hajjaji, S., 2024. Methods and Technologies for the Treatment and Disposal of Brine in Seawater Desalination Plants, in Advances in Environmental Engineering and Green Technologies, J. Mabrouki and M. Azrour, Eds., IGI Global, 2024, pp. 79-87, doi: 10.4018/979-8-3693-3807-0.ch007.
  • Basheir, E., Makkawi, Y., and Masek, O., 2024. Management and potential application of desalination brine reject in CO2 capture and catalytic conversion processes, Journal of Water Process Engineering, vol. 66, pp. 105956, September 2024, doi: 10.1016/j.jwpe.2024.105956.
  • Bencheikh, I., Mabrouki, J., Azoulay, K., Moufti, A., and El Hajjaji, S., 2020. Predictive analytics and optimization of wastewater treatment efficiency using statistic approach. In Big Data and Networks Technologies 3 (pp. 310-319). Springer International Publishing.
  • Bencheikh, I., Mabrouki, J., Azoulay, K., Moufti, A., and El Hajjaji, S., 2020. Consequences of Brine Discharges from Seawater Desalination on the Marine Ecosystem, Case Study of the Kahrama Station in the North West of Algeria, Applied Ecology and Environmental Research, vol. 22, no 2, 2024.
  • Benchrifa, M., Elouardi, M., Fattah, G., Mabrouki, J., and Tadili, R., 2023. Identification, simulation and modeling of the main power losses of a photovoltaic installation and use of the internet of things to minimize system losses. In Advanced technology for smart environment and energy (pp. 49-60). Cham: Springer International Publishing.
  • Benchrifa, M., Mabrouki, J., and Tadili, R., 2022. Estimation of global irradiation on horizontal plane using artificial neural network. In The International Conference on Artificial Intelligence and Smart Environment (pp. 395-400). Cham: Springer International Publishing.
  • Bhandari, M., Kharkwal, S., and Prajapati, S. K., 2023. Recycling drinking water RO reject for microalgae-mediated resource recovery, Resources, Conservation and Recycling, vol. 188, p. 106699, January 2023, doi: 10.1016/j.resconrec.2022.106699.
  • Dashputre, A., Kaushik, A., Pal, A., Jariwala, D., Yadav, K., and Shah, M., 2023. Geothermal energy integrated multi-effect evaporator (MEE) and multi-effect distillation (MED)-based desalination systems: an ecofriendly and sustainable solutions, Environ Sci Pollut Res, vol. 30, no 26, pp. 67941-67952, June 2023, doi: 10.1007/s11356-023-26858-w.
  • Dashputre, A., Kaushik, A., Pal, A., Jariwala, D., Yadav, K., and Shah, M., 2023. Techno-economic feasibility and environmental impact evaluation of a hybrid solar thermal membrane-based power desalination system, Energy, vol. 278, p. 127923, September 2023, doi: 10.1016/j.energy.2023.127923.
  • de Miguel, E., Avila, D., and Marichal, G. N., 2023. The environmental impact of water intakes and discharges for desalination. doi: 10.1109/ICECCME57830.2023.10252182.
  • Altıok, E., Cihanoğlu, A., Güler, E., and Kabay, N., 2024. Chapter 5 – Ion exchange membranes in electrodialysis process for wastewater treatment, in Current Trends and Future Developments on (Bio-)Membranes, A. Basile and K. Ghasemzadeh, Eds., Elsevier, 2024, pp. 123-156, doi: 10.1016/B978-0-323-88509-6.00005-8.
  • Elshaikh, A., Elsheikh, E., and Mabrouki, J., 2024. Applications of Artificial Intelligence in Precision Irrigation, Journal of Environmental and Earth Sciences, vol. 6(02).
  • Fahdi, G., Azdem, D., Lamchaimech, A., Benrhanem, M., Mabrouki, J., El Hajjaji, S., 2024. Analysis Of The Impact Of Climate Change On Water Resources: Case Of The Tensift Basin (Morocco), Water Conservation and Management, vol. 8, no 4, pp. 461-465, 2024, doi: 10.26480/wcm.04.2024.461.465.
Pages 55-60
Year 2025
Issue 1
Volume 9

Download

Water Conservation and Management (WCM)

wcm.01.2025.49.54

HEAVY METAL REMOVAL FROM INDUSTRIAL WASTEWATER USING PINECONE
SEED POWDER AND ALUMINUM CHLORIDE-BASED HYBRID NATURAL/CHEMICAL COAGULATION

Journal: Water Conservation and Management (WCM)
Author: Mohammed Shadi S. Abujazar, Salem S. Abu Amr, Motasem Y. D. Alazaiza, Ahmed Albahnasawi, Madhusudhan Bangalore Ramu
Print ISSN : 2523-5664
Online ISSN : 2523-5672

This is an open access article distributed under the Creative Commons Attribution License CC BY 4.0, which permits unrestricted use, distribution, and reproduction in any medium, provided the original work is properly cited

Doi: 10.26480/wcm.01.2025.49.54

Abstract

This study presents an innovative strategy combining Pinecone Seed powder (PSP) and aluminum chloride (AlCl3) to remove heavy metals from industrial wastewater, optimizing PSP/AlCl3 quantities and pH levels, identifying a 3:1 (g/g) dose ratio as most effective with efficiencies of 86.47% for COD, 91.85% for color, 99.00% for TSS, 93.62% for NH3-N, and 98.49% for Mn, among others, while maintaining a pH of 8, demonstrating the sustainability of the PSP/AlCl3 coagulation technique, though further research is needed for scalability and practical application.

Keywords

Coagulation, heavy metals, combined, PSP/AlCL3, wastewater treatment

1. INTRODUCTION

The growth of socioeconomic behavior and the expansion of people, combined with the constricted availability of water due to climate change and human actions, have given rise to conflicts regarding the allocation of water resources (Yuan et al., 2023; Zuo et al., 2023; Morán-Valencia et al., 2023); consequently, the task of managing water resources has grown increasingly intricate, as the fast increase of industries contributed to a substantial effect in the worldwide spending of water (Ke et al., 2022), with this industrial advancement predominantly driving the expansion of chemical sectors, leading to an upsurge in water pollution problems across nations (Issakhov et al., 2023), as the release of wastewater from these chemical industries constitutes a substantial origin of water contamination, and although industrial effluents usually undergo some treatment, their attributes differ based on the specific production methods and raw materials, generally consisting of suspended solids ranging from 300 to 400 mg/L (Ifeanyi et al., 2012), while specific industries discharge highly polluted wastewater containing organic contaminants and heavy metals (Mao et al., 2022), prompting various technologies to tackle this challenge, notably the coagulation-flocculation method, which has surfaced as the prevalent and economically viable strategy for treating wastewater (Metin and Çifçi, 2023), alongside other alternative technologies like adsorption membrane filtration, ion exchange (Chakraborty et al., 2022), advanced oxidation processes, and more (Tan et al., 2022; Elmoutez et al., 2023; Lanzetta et al., 2023); hence, a pressing need exists to formulate efficient techniques to immobilize or eliminate heavy metals to curtail their adverse impacts (Ifeanyi et al., 2012), with coagulation-flocculation procedures capturing substantial technical attention owing to their impressive efficiency, cost-effectiveness, simplicity of deployment, and the diverse array of coagulants accessible (Abujazar et al., 2023), applied across numerous industries, including textiles, iron and steel, chemicals, pharmaceuticals, and petrochemicals (Ejimofor et al., 2020), using strongly positively charged metallic coagulants such as ferric sulfate, aluminum sulfate, and ferric chloride (Pang et al., 2011; Abujazar et al., 2022; Abujazar et al., 2022), although this strategy has drawbacks like high import costs, sludge production, and pH level variations (Abujazar et al., 2022), prompting the use of natural coagulants instead of inorganic chemicals as a practical method for handling various industrial effluent (Owodunni and Ismail, 2021), with studies highlighting natural coagulants extracted from plants like date seeds, water hyacinth, moringa seeds, locust bean seeds, olive seeds, rosehip seeds, and other substances (Abujazar et al., 203; Šćiban et al., 2005; Yongabi, 2010; Karaağaç et al., 2022; Abujazar et al., 2022; Abujazar et al., 2022; Madrona et al., 2017), which have shown high performance in wastewater treatment and stand as environmentally friendly, cost-effective options (Yang et al., 2019), driving efforts to develop effective organic-inorganic hybrid strategies that enhance inorganic coagulants by introducing innovative natural polymeric materials (El-Gaayda et al., 2021; Iloamaeke and Julius, 2019; Owodunni et al., 2023; Shabanizadeh and Taghavijeloudar, 2023), and aligned with this view, the current investigation evaluated the efficacy of a hybrid coagulation process combining natural and chemical wastewater treatment agents to identify optimal pH and dosage requirements necessary for the best performance of a Pinecone Seed Powder and Aluminum Chloride-based hybrid natural/chemical coagulation (PSP/AlCl3) process, aiming to produce high-quality treated water for reuse in an iron and steel factory, incorporating PSP as a natural coagulant with AlCl3 as a chemical coagulant to optimize combined effects for efficient iron wastewater treatment through synergy, alongside a comparative analysis of PSP alone versus the PSP/AlCl3 hybrid approach in pollutant and heavy metal removal efficacy.

2. MATERIALS AND METHODS
2.1 Source of Wastewater and Sample Collection
Wastewater samples were collected from the industrial factory in Karabuk City, Turkey, using the grab sampling method without any dilution, and were stored in a refrigerator at 4°C after collection to avoid any change in sample characteristics; comprehensive details regarding the wastewater’s composition can be found in Table 1, while 1 N H2SO4/NaOH solution was used for pH monitoring during sample testing.

2.2 Pinecone Seed Powder (PSP) Natural Coagulant Preparation

Carefully selected Pinecone Seeds were gathered from a forest near Karabuk University in Turkey, meticulously rinsed with distilled water to remove any adhering flesh, air-dried at room temperature, then subjected to an eight-hour drying period in an oven at 50 ± 1°C; after manual husk removal, the seeds were finely ground with a laboratory mortar, further refined using a Retsch RS 200 grinder to produce a consistent and homogeneous Pinecone Seed Powder (PSP), which was employed as a natural coagulant in the wastewater treatment process detailed in the study (refer to Fig. 1 for an illustration).

This table shows the results of water treatment with ozone over different time intervals (10, 20, 30, and 40 minutes). The concentration of ammonia (NH₃) significantly decreased from an initial concentration of 130 mg/L to 1 mg/L after 40 minutes of treatment. Nitrates (NO₃⁻) reduced from 50 mg/L to 7 mg/L, and nitrites (NO₂⁻) completely disappeared after 30 minutes. Phosphates (PO₄³⁻) dropped from 30 mg/L to 0 mg/L after 40 minutes, demonstrating the effectiveness of the process for phosphorus compounds. Other harmful components such as sulfates (SO₄²⁻), iron (Fe), and copper (Cu) also showed significant reductions over time, indicating the efficiency of ozone treatment in reducing contamination.

Now let’s visualize the data from this table in graphical form. The research results are presented in Figures 6, 7, and 8 below.

2.3 Chemicals
All the chemicals used in this study were procured from Sigma-Aldrich
Chemical Co. (St Louis, MO, USA).

2.4 Coagulation Experiments
An orbital shaker was used to conduct coagulation-flocculation experiments. To evaluate the impact of the hybrid coagulant, a 3 g/L dosage of pinecone seed (Karaağaç et al., 2022) was combined with several dosages of AlCl3 (0.5, 1, 1.5, 2, and 2.5 g). These dosages were mixed with one liter of raw wastewater in 500 ml beakers. Afterward, 200 ml of the sample was slowly poured into a 500 ml beaker on the shaker plate. Samples were mixed gently at a rate of 200 rpm for 5 minutes, followed by softer mixing at 90 rpm for 30 minutes. The beakers were then left to settle for half an hour. Contaminants were removed using Whatman filter paper to produce a clear sample. The effectiveness of different parameters, such as COD, TSS, NH3-N, and the presence of heavy metals, was assessed using this treated sample. The initial pH of the wastewater sample taken from the iron and steel industry was 8, which is also the pH at which these studies were carried out. A hybrid technique was used, integrating a chemical coagulant (AlCl3) and a natural coagulant (processed PSP) at varying doses. Additionally, the pH level was recognized as a pivotal variable. For each combination of the natural and chemical coagulants at their respective optimal concentrations, the pH was modulated to a spectrum of values from 4 to 11, accomplished using either 0.1 N NaOH or H2SO4.

2.5 Analytical Methods

The effectiveness of the hybrid coagulation/flocculation process was assessed by analyzing several crucial parameters, including COD, TSS, NH3-N, and the concentration of heavy metals present in the original pH (8) of the raw wastewater. All tests were measured using analytical techniques following the Standard Method of Water and Wastewater, as detailed in Table 2. Throughout the experimentation, the pH levels of the samples were meticulously controlled using a 1 N H2SO4/NaOH solution (Veli et al., 2021).

To calculate the removal efficiency, Equation 1 was used. This formula considers both the initial concentration of the untreated industrial wastewater sample and the industrial wastewater’s concentration after treatment.

Removal efficiency(%) = [1 − (Cf / Ci)] * 100

where Ci was the initial concentration before treatment, and Cf was the final concentration after treatment of each parameter.

3. RESULTS AND DISCUSSION
3.1 Effect of PSP/ AlCl3 Dosages

To comprehensively assess the impact of hybrid coagulation on treatment efficiency, several dosages of the hybrid coagulant were applied during wastewater treatment. This series of experiments involved the utilization of the best dosage of Pinecone Seed Powder coagulant (3 g/L) combined with varying quantities of AlCl3 as mentioned earlier, all incorporated into 1 liter of raw wastewater (Abujazar et al., 2022). These mixtures were vigorously agitated on the shaker, employing the conditions detailed in section 2.3 to pinpoint the dosage that yields the highest removal efficiency. As underscored, it is crucial to recognize that the surface charge of the coagulant can significantly influence coagulation performance, mainly because of its mass (Ramavandi and Farjadfard, 2014). The coagulation process facilitated by this hybrid coagulant primarily engages in adsorption bridging mechanisms. Pinecone Seed Powder (PSP) operates through charge neutralization as its coagulation mechanism (Ghernaout, 2020). In the PSP coagulation process context, a charge neutralization mechanism elucidates its function. Conversely, the AlCl3 coagulant, as part of the removal coagulation mechanism, undergoes hydrolysis upon introduction into the water sample.

Pages 49-54
Year 2025
Issue 1
Volume 9

Download

Water Conservation and Management (WCM)

wcm.01.2025.40.48

STUDY OF THE WASTEWATER TREATMENT PROCESS USING ELECTRICAL DISCHARGE

Journal: Water Conservation and Management (WCM)
Author: Askar Abdykadyrov, Maxat Mamadiyarov, Kyrmyzy Taissariyeva, Sunggat Marxuly, Nuridin Junussov, Muratbek Yermekbayev, Abdurazak Kasimov, Anar Khabay
Print ISSN : 2523-5664
Online ISSN : 2523-5672

This is an open access article distributed under the Creative Commons Attribution License CC BY 4.0, which permits unrestricted use, distribution, and reproduction in any medium, provided the original work is properly cited

Doi: 10.26480/wcm.01.2025.40.48

Abstract

This research focuses on studying the process of wastewater treatment using electrical discharge. The introduction highlights the harmful effects of ammonia, nitrites, phosphates, and heavy metals found in wastewater and their impact on water pollution. The purpose of the study is to investigate and evaluate the efficiency of decomposing harmful substances in water using ozone and hydroxyl radicals generated by high- and low-frequency electrical discharges. During the experiment, a voltage of 15 kV and an ozone concentration of 600 g/h were applied. The results showed that the initial ammonia concentration decreased from 130 mg/L to 1 mg/L, while nitrites were reduced from 0.5 mg/L to 0 mg/L. In addition, phosphates (from 30 mg/L to 0 mg/L), chlorides (from 250 mg/L to 20 mg/L), and sulfates (from 200 mg/L to 18 mg/L) significantly decreased. The COD level dropped by 70%, from 800 mg/L to 0 mg/L, and the bacterial count decreased by 85% within 30 minutes, reaching 100% elimination by 60 minutes. The energy consumption was 0.5 kWh per liter of water, proving this method to be an efficient and environmentally friendly solution. The conclusion highlights the potential of the electrical discharge method for water purification without chemical additives, its environmental safety, and its applicability on an industrial scale.

Keywords

Wastewater treatment, electrical discharge, contaminant decomposition, high-frequency electric field, chemical oxygen demand (COD), bacterial elimination, environmental safety, sustainable technology

1. INTRODUCTION

Wastewater treatment using electrical discharge is one of the promising methods aimed at addressing environmental issues (Saravanan, et al., 2021). Effluents from many industrial facilities and household waste contain high levels of chemical pollutants, bacteria, and viruses that harm ecosystems (Gurreri et al., 2020; Kozhaspaev et al., 2016). Such contaminated water poses a significant threat to ecosystems, reducing biodiversity in water sources and negatively impacting the environment. Today, protecting water sources, recycling, and maintaining them in an environmentally safe state has become a crucial task (Cosgrove and Loucks ., 2015).

Treatment through electrical discharge is a modern technology that uses a high-frequency electric field to decompose contaminants in water (Abdykadyrov et al., 2021). As a result of the electric discharge, ozone, hydrogen peroxide, and other strong oxidants are formed, which break down harmful substances in the water. This process turns heavy metals, bacteria, and organic substances in the water into harmless components, resulting in ecologically clean water (Abdykadyrov et al., 2020).
One of the unique features of treatment through electrical discharge is its ability to reduce pollution without the use of chemical additives. The environmental safety of this technology is one of its main advantages, as no additional chemical substances are introduced into the water. Therefore, it provides efficient cleaning without harming the environment. Economically, it is also advantageous, as water treatment can be achieved by using only electrical energy, without the cost of additional chemicals (Ahmed et al., 2021; Abdykadyrov et al., 2023)

This method is currently used in many countries to comply with environmental standards. Researchers are studying ways to adjust various parameters, such as voltage, frequency, and temperature, to increase the effectiveness of electrical discharge. These studies contribute significantly to ensuring water’s environmental cleanliness, protecting human health, and preserving water resources. Furthermore, the potential for industrial-scale application of this technology is being explored, as it is easily scalable and considered effective in many cases (Anpilov et al., 2001; Chung et al., 2015) .

Another advantage of electrical discharge technology is its adaptability to different types of contaminated water. This technology can be used for treating industrial effluents, household waste, and agricultural wastewater. Research has shown that this method can effectively eliminate even hard-to-decompose organic pollutants, heavy metals, and petroleum products (Boyko and Makogon, 2020).

The wastewater treatment method using electrical discharge meets modern environmental standards. It supports principles of sustainable development and efficient resource utilization. By ensuring water cleanliness, it facilitates the restoration and preservation of natural ecosystems (Macedonio et al., 2012; Alkhadra et al., 2022). Currently, this technology plays an important role in protecting water resources and enhancing ecological safety.

For this scientific research, we developed a pilot ETRO-02 ozonator unit based on electrical discharge specifically for wastewater treatment near Talgar city in the Almaty region. This is necessary because the community within a 150-meter radius of the wastewater source is facing environmental issues. The residents of the village urgently need access to quality water and clean air. To address this environmental issue, we have decided to carry out wastewater treatment efforts at the Kazakh National Research Technical University named after K.I. Satbayev.

2. METHODS AND METHODOLOGY

The treatment of wastewater and the surrounding air through the effect of electrical discharge is one of the important research areas of modern times. Wastewater collected from various cities is rich in pollutants, and its effective purification plays a crucial role in solving environmental problems. In this study, we examined the possibility of decomposing harmful substances in wastewater using an electrical discharge. Unlike conventional purification methods, electrical discharge promotes the formation of ozone, hydroxyl radicals, and other active substances in wastewater. These compounds effectively decompose organic and inorganic pollutants, thereby purifying the water (Jałowiecki,et al., 2024).

To conduct the study, wastewater samples were taken and initially passed through a mechanical filter. This procedure helped to remove large particles and debris, leaving clean samples for subsequent processes. Then, the water was treated with high-voltage electrical discharge. High-frequency discharge generates a significant amount of ozone, which has a substantial impact on organic pollutants. Low-frequency discharges consistently produce hydroxyl radicals, which demonstrated high efficiency in reducing chemical contamination. Now, let us proceed with theoretical analysis. To perform theoretical calculations, we will apply reaction equations and transformations corresponding to each stage of the process. The model includes mechanical filtration, high-frequency electrical discharge for ozone generation, and low-frequency discharge for hydroxyl radical production (Abdykadyrov et al., 2023).

Mechanical filtration of large particles and impurities. During the mechanical filtration stage, the concentration of large particles in wastewater is reduced.

where: Cinitial is the initial concentration of large particles (mg/L or another appropriate unit), ηfilter is the efficiency of the mechanical filter. Example: If the initial concentration Cinitial = 100mg/L and the filter ηfilter = 0.9 (90%), then: С𝑓𝑓𝑓𝑓𝑓𝑓𝑓𝑓𝑓𝑓𝑓𝑓𝑓𝑓𝑓𝑓=100∙(1−0,9)=10mgL. The concentration of large particles after filtration is 10 mg/L.
Ozone Generation by High-Voltage Electric Discharge. Ozone generation can proceed according to the following reaction:

During high-frequency discharge, ozone concentration can be expressed as a function of time:

where: kozone is the rate constant of ozone formation, [O2] is the concentration of dissolved oxygen (mol/L), Ihigh is the intensity of the high-frequency discharge, kdecomp is the rate constant of ozone decomposition. Example: If the initial oxygen concentration [O2] = 0.02 mol/L, Ihigh = 1.5, kozone = 0.1 and kdecomp = 0.05 then the rate of change of ozone concentration over time is: 𝑑 [𝑂𝑂3]𝑑 =0,1∙0,02·1,5−0,05∙[𝑂𝑂3], 𝑑 [𝑂𝑂3]𝑑 =0,003−0,05∙[𝑂𝑂3]. This equation can be solved numerically to determine the time-dependent concentration of ozone.
Hydroxyl Radical Generation by Low-Frequency Electric Discharge. When water is treated with low-frequency discharge, the concentration of hydroxyl radicals (𝑶𝑶𝑶𝑶∗) increases, which is crucial for breaking down organic pollutants:

where: kOH is the rate constant of hydroxyl radical formation, [H2O] is the concentration of water molecules, Ilow is the intensity of the low-frequency discharge, kreact is the rate constant of the reaction between hydroxyl radicals and organic substances. Example: If kOH = 0.05, [H2O] = 55.5 mol/L, Ilow = 0.8, kreact = 0.03, and the concentration of organic pollutants [Corganic] = 0.01, then: 𝑑 [𝑂𝑂𝑂𝑂∗]𝑑 =0,05∙55,5·0,8−0,03∙[𝑂𝑂𝑂 ∗]∙0,01, 𝑑 [𝑂𝑂𝑂𝑂∗]𝑑 =2,22−0,0003∙[𝑂𝑂𝑂 ∗]. This equation can be solved to find the concentration of hydroxyl radicals.
Reduction of Organic Pollutants Concentration. The concentration of organic pollutants decreases due to the effects of ozone and hydroxyl radicals. This process can be represented by the following equation:

where: kozone_reactk is the rate constant of the reaction between ozone and organic pollutants.

These theoretical calculations allow us to model ozone and hydroxyl radical formation and the reduction of organic contaminants during various stages of wastewater treatment by electric discharge.

During the procedure, various voltage levels and treatment durations were applied. For example, a voltage of 15 kV was tested over 15, 30, and 60 minutes. Digital data was collected during the experiments, allowing for a comparison of the initial and final composition of the water. When high-frequency discharge was applied, the chemical oxygen demand (COD) of the water decreased by up to 70% within 60 minutes. In biological studies, the bacterial count dropped by 85% within the first 30 minutes and was completely eliminated by 60 minutes. The research results were analyzed and graphically represented using Python. The outcome can be seen in Figure 1 below [18,19].

In Figure 1a, the reduction in Chemical Oxygen Demand (COD) levels in wastewater is shown in relation to the treatment time with electrical discharge. After 15 minutes of treatment, COD decreased by 30%, by 50% at 30 minutes, and by 70% at 60 minutes. These results indicate that as the treatment time increases, the reduction in COD levels significantly improves. In Figure 1b, the level of bacterial elimination is shown in relation to treatment time with electrical discharge. After 15 minutes, bacterial count decreased by 85%, reaching 100% elimination after 30 minutes, meaning complete eradication. After 30 minutes, no bacteria remained, and the elimination level remained consistently at 100% up to 60 minutes.

The effect of electrical discharge was evaluated not only by its efficiency but also by its power consumption. When treating one liter of wastewater with a discharge of 15 kV, the power consumption was 0.5 kWh. This method is environmentally effective, as electric power helps to eliminate pollutants to obtain clean water. Such technologies may find broad applications in waste processing in the future. The high efficiency of the method was demonstrated in laboratory results, indicating the need for further development. The use of such technologies in urban sewer systems can help conserve clean water and maintain ecological balance. The research results can be observed in Figure 2 below.

In Figure 2, the Applied Voltage parameter is shown to be 15 kV, while Power Consumption is at the level of 0.5 kWh, indicating the energy efficiency of this method. The Ecological Efficiency, Laboratory Results, and Environmental Benefit parameters were rated with a maximum score of 5, highlighting the ecological and scientific value of the method. Future Application Potential and Application Potential were rated at 4, indicating a high potential for future use of the method.

3. RESULTS AND DISCUSSIONS

Based on theoretical studies in the Materials and Methods section, a laboratory model of the pilot ETRO-02 ozonator unit, based on electrical discharge, was developed at the Department of Electronics, Telecommunications, and Space Technologies of the Kazakh National Research Technical University named after K.I. Satbayev. The structural design and overall appearance of the laboratory model are shown in Figure 3 below.

And the overall technological system of the setup is presented in Figure 4 below.

This Figure 4 describes the full structure of the water purification system based on the ozonation process. The operation of the system consists of several stages, and each component has a specific function. Below is an analysis of each component and its role in the system:

 Laboratory autotransformer – this component regulates and provides the necessary electrical power to the entire system. It takes power from an external 220V (50Hz) electrical network and adjusts it to the required level for the ozonator and other components. The autotransformer ensures the stable and reliable operation of the system;

 High voltage generator 10-21 kV – a generator that supplies high voltage with a frequency of 13 kHz. This generator ensures the normal operation of the ozonator since high voltage and a stable frequency are required for ozone-generating reactions. It transforms oxygen molecules in the system into ozone molecules;

 ETRO-02 ozonator unit – the ozonator unit is the central element of the
system. It generates ozone from air and purifies the water through an oxidation process. The use of ozone is an effective technology for disinfection and the removal of harmful contaminants;

 Compressor supplying air to the ozonator and Air drying and preparation system – these two components support the operation of the ozonator. The compressor supplies the necessary airflow to the ozonator, and the air drying and preparation system reduces the humidity in the air, which is essential for efficient ozone production;

 Initial untreated water reservoir – the untreated water that needs to be purified is collected in this reservoir. This water then passes through the next stages of the system, including ozonation and filtration processes;

 Filter station made of various types of sand – the filtration of large particles from the water is carried out at this stage. The sand filter mechanically cleans the water, removing large impurities, which enhances the overall efficiency of the process;

 Ozonation chamber – water is treated with ozone in this chamber, where it undergoes an oxidation reaction with harmful contaminants. During this stage, the water is chemically disinfected;

 Membrane filter – after the ozonation process, the water passes through a membrane filter, which removes microparticles and residual contaminants. This filter represents the final stage of purification, allowing for the production of clean water;

 Water for irrigation or consumption – finally, the purified water is ready for use, either for consumption or irrigation. As the water has passed through the ozonation and filtration processes, it is of high quality and completely free from harmful substances.

This system illustrates a laboratory setup designed for effective water purification. It can be used for conducting experiments and modifying the chemical and physical properties of water. The ozonation process is the core part of the system, and its main objective is to remove harmful contaminants in the water through oxidation.

3.1 Experimental Results

To conduct the scientific research experiment, water was collected from a specific site (Figure 5) and delivered to a scientific laboratory. The initial concentration of toxic chemical compounds in the water can be observed in Table 1.

The table shows the initial concentration of harmful substances in wastewater and their maximum allowable limits. When the concentration of each chemical element exceeds the permissible limit, it can have harmful effects on human health, for example, posing risks to the respiratory or nervous system.

To solve this problem, the process of oxidizing and purifying harmful compounds in water after filtration was carried out in two approaches. The first approach involved keeping the ozone concentration constant (ozone concentration C, 600 g/hour) and varying the oxidation time. The results of this study are presented in Table 2 below. In contrast, the second approach kept the oxidation time constant while varying the ozone concentration. The results of this study are presented in Table 3 below.

1. Research Results for the First Approach:

This table shows the results of water treatment with ozone over different time intervals (10, 20, 30, and 40 minutes). The concentration of ammonia (NH₃) significantly decreased from an initial concentration of 130 mg/L to 1 mg/L after 40 minutes of treatment. Nitrates (NO₃⁻) reduced from 50 mg/L to 7 mg/L, and nitrites (NO₂⁻) completely disappeared after 30 minutes. Phosphates (PO₄³⁻) dropped from 30 mg/L to 0 mg/L after 40 minutes, demonstrating the effectiveness of the process for phosphorus compounds. Other harmful components such as sulfates (SO₄²⁻), iron (Fe), and copper (Cu) also showed significant reductions over time, indicating the efficiency of ozone treatment in reducing contamination.

Now let’s visualize the data from this table in graphical form. The research results are presented in Figures 6, 7, and 8 below.

These Figures 6, 7, and 8 show the reduction in concentrations of various chemical compounds over time during water purification with ozone. In the first graph, significant decreases in the concentrations of ammonia, nitrates, nitrites, phosphates, chlorides, and sulfates are observed. The second graph also demonstrates reductions in lead, COD, BOD, calcium, and magnesium concentrations over time. The third graph shows a steady decline in the concentrations of iron, copper, and zinc, indicating the effectiveness of the water purification process using ozone.

2. Research Results for the Second Approach:

This table shows the effect of different ozone concentrations (150 g/hour, 300 g/hour, 450 g/hour, 600 g/hour) during the water purification process. The initial concentration of ammonia (NH₃) was 130 mg/L, which decreased to 1 mg/L after 40 minutes of treatment with 600 g/hour ozone. Nitrates (NO₃⁻) dropped from an initial 50 mg/L to 7 mg/L at the highest ozone concentration. Phosphates (PO₄³⁻) were completely removed, decreasing from 30 mg/L to 0 mg/L at 600 g/hour. Additionally, chlorides (Cl⁻) and sulfates (SO₄²⁻) also significantly decreased, with the purification efficiency increasing as the ozone concentration increased.

Now let’s visualize the data from this table in graphical form. The research results are presented in Figures 9, 10 and 11 below.

These three graphs (Figure 9,10 and 11) demonstrate the effectiveness of the water purification process using different amounts of ozone (150 g/h – 600 g/h). The concentrations of pollutants like ammonia, nitrates, phosphates, chlorides, iron, and lead significantly decrease as the amount of ozone increases. Notably, at the highest concentration (600 g/h), many harmful substances drop below the MAC limit or are completely eliminated. Overall, the effectiveness of ozone treatment depends on the initial concentration of pollutants and the amount of ozone used.

3.2 The Mathematical Model of Ozone’s Chemical Interaction with Harmful Substances In Water
Ozone (O₃) is a highly effective oxidizer that reacts with harmful substances in water, breaking them down or converting them into harmless products. The mathematical model of ozone’s effectiveness in reducing the concentration of various pollutants can be developed using chemical reaction equations and kinetics. Below is the mathematical model with chemical reaction equations for each substance.

Ammonia (NH₃) Model. Ammonia reacts with ozone and is oxidized into nitrogen and water:
4𝑁𝑁𝐻𝐻3+3𝑂𝑂3→2𝑁𝑁2+3𝐻𝐻2𝑂𝑂+3𝑂𝑂2 (7)
Mathematically, this reaction can be described by a first-order kinetic equation:
𝑑
[𝑁𝑁𝐻 3]𝑑 =−𝑘𝑘1[𝑁𝑁𝐻𝐻3][𝑂𝑂3] (8)
where: [NH3] is the concentration of ammonia, [O3] is the concentration of ozone, k1 is the rate constant of the reaction.
Nitrites (NO₂⁻) and Nitrates (NO₃⁻) Model. Nitrites are oxidized by ozone to form nitrates:
2𝑁𝑁𝑂𝑂2−+𝑂𝑂3→2𝑁𝑁𝑂𝑂3− (9)
The kinetic equation for nitrites is:
𝑑
[𝑁𝑁𝑂𝑂2−]𝑑 =−𝑘𝑘2[𝑁𝑁𝑂𝑂2−][𝑂𝑂3] (10)
For nitrates:
𝑑
[𝑁𝑁𝑂𝑂3−]𝑑 =𝑘𝑘2[𝑁𝑁𝑂𝑂2−][𝑂𝑂3] (11)
Phosphates (PO₄³⁻) Model. Phosphates do not directly react with ozone, but they can be associated with organic compounds that break down during the process:
𝑑
[PO₄³⁻]𝑑 =−𝑘𝑘3[PO₄³⁻][𝑂𝑂3] (12)
where k3 is the rate constant for phosphates.
Chlorides (Cl⁻) Model. Chlorides may not directly react with ozone, but organic chlorides may be broken down by ozone:
𝑑
[𝐶𝐶𝐶 −]𝑑 =−𝑘𝑘4[𝐶𝐶𝐶𝐶−][𝑂𝑂3] (13)
Iron (Fe), Copper (Cu), and Zinc (Zn) Model. These metals are oxidized by ozone into insoluble oxides. For example, iron oxidation can be represented as:
2𝐹𝐹𝐹 2++𝑂𝑂3+2𝐻𝐻2𝑂𝑂→2𝐹𝐹𝐹𝐹𝐹𝐹 (𝑂𝑂𝑂 )+𝑂𝑂2+4𝐻𝐻+ (14)
The kinetic equation for iron is:
𝑑
[𝐹𝐹𝐹 2+]𝑑 =−𝑘𝑘5[𝐹𝐹𝐹 2+][𝑂𝑂3] (15)
Lead (Pb) Model. Lead does not directly react with ozone but may be removed due to other chemical processes:
𝑑
[𝑃𝑃𝑃𝑃]𝑑 =−𝑘𝑘6[𝑃𝑃𝑃𝑃][𝑂𝑂3] (16)
Chemical Oxygen Demand (COD) and Biochemical Oxygen Demand (BOD) Models. COD and BOD represent the organic load in the water. Ozone oxidizes organic matter, breaking it down into carbon dioxide and water:
Organic Matter+𝑂𝑂3→𝐶𝐶𝐶 2+𝐻𝐻2O (17)
The kinetic equation for COD is:
𝑑
[COD]𝑑 =−𝑘𝑘7[𝐶𝐶𝐶 𝐶𝐶][𝑂𝑂3] (18)
And for BOD:
𝑑
[BOD]𝑑 =−𝑘𝑘8[𝐵𝐵𝐵𝐵𝐵𝐵 ][𝑂𝑂3] (19)
General Mathematical Model. The overall system of equations describing the concentration changes of each pollutant over time is:
𝑑
[𝑁𝑁𝐻 3]𝑑 =−𝑘𝑘1[𝑁𝑁𝐻𝐻3][𝑂𝑂3] (20)
𝑑
[𝑁𝑁𝑂𝑂2−]𝑑 =−𝑘𝑘2[𝑁𝑁𝑂𝑂2−][𝑂𝑂3] (21)
𝑑
[𝑁𝑁𝑂𝑂3−]𝑑 =𝑘𝑘2[𝑁𝑁𝑂𝑂2−][𝑂𝑂3] (22)
𝑑
[PO₄³⁻]𝑑 =−𝑘𝑘3[PO₄³⁻][𝑂𝑂3] (23)
𝑑
[𝐶𝐶𝐶 −]𝑑 =−𝑘𝑘4[𝐶𝐶𝐶𝐶−][𝑂𝑂3] (24)
𝑑
[𝐹𝐹𝐹 2+]𝑑 =−𝑘𝑘5[𝐹𝐹𝐹 2+][𝑂𝑂3] (25)
𝑑
[COD]𝑑 =−𝑘𝑘7[𝐶𝐶𝐶 𝐶𝐶][𝑂𝑂3] (26)
𝑑
[BOD]𝑑 =−𝑘𝑘8[𝐵𝐵𝐵𝐵𝐵𝐵 ][𝑂𝑂3] (27)
Constant Ozone Concentration. If we assume a constant ozone concentration ([O3] = const), each equation simplifies into a first-order differential equation where the concentration of pollutants decreases exponentially:
[𝑁𝑁𝐻𝐻3](𝑡𝑡)=[𝑁𝑁𝐻𝐻3]0∙𝑒𝑒−𝑘𝑘1[𝑂𝑂3]𝑡 (28)
where [NH3]0 is the initial concentration of ammonia. Similarly, the concentrations of other pollutants will follow an exponential decay model over time.
This mathematical model describes the reduction of harmful substances in water depending on the amount of ozone used and the time of treatment. Each pollutant’s concentration can be calculated based on the rate constants and the ozone concentration, helping optimize the water purification process and determine the necessary ozone dosage.
3.3 Analysis of Research Results
In this process, strong oxidizers such as ozone and hydroxyl radicals are formed. The study demonstrated that high – and low-frequency discharges effectively decompose organic and inorganic pollutants and eliminate bacteria. The method has environmental and economic advantages, as it provides water purification without chemical additives and with low energy consumption. The analysis of the research results is as follows:
 The wastewater treatment process using ozone showed a significant reduction in harmful substances over time and with increasing ozone concentration;
 As seen in Figure 6, pollutants like ammonia (NH₃), nitrates (NO₃⁻), nitrites (NO₂⁻), phosphates (PO₄³⁻), chlorides (Cl⁻), and sulfates (SO₄²⁻) decreased substantially during the treatment, with some pollutants being fully eliminated after 40 minutes of treatment;
 Phosphates were reduced to zero, demonstrating the effectiveness of ozone treatment in breaking down phosphorus compounds;
 Figure 7 demonstrates the reduction in concentrations of lead (Pb), COD, BOD, calcium (Ca), and magnesium (Mg) over time. Lead was completely eliminated during the treatment, while COD and BOD showed substantial reductions, indicating improved water quality;
 The highest ozone concentration (600 g/h) achieved almost complete elimination of ammonia and other pollutants, indicating that ozone dosage plays a crucial role in the efficiency of water treatment;
 The oxidation time also has a significant impact on the reduction rates, with longer treatment times resulting in higher reductions of contaminants;
 Figure 8 illustrates a steady decline in the concentrations of metals like iron (Fe), copper (Cu), and zinc (Zn) during water purification. This indicates that ozone is effective at removing heavy metals;
 The bacterial count dropped by 85% after the first 30 minutes of treatment, reaching 100% elimination by 60 minutes, showing ozone’s ability to disinfect water effectively
;
 The electrical discharge method demonstrated a power consumption of 0.5 kWh per liter, making it a cost-efficient and environmentally friendly solution;
 The research results suggest that the ozone treatment method could be applied at a larger scale for wastewater treatment in urban areas to improve water quality and protect ecosystems.
These results, depicted in the graphs, demonstrate the clear effectiveness of ozone in reducing both chemical and biological contaminants in wastewater.
4. CONCLUSION
This research demonstrated the effectiveness and environmental safety of wastewater treatment using electrical discharge. The use of high- and low-frequency electrical discharges to reduce chemical and biological pollutants in wastewater has proven to be an effective method. The study recorded quantitative changes in the chemical and biological composition of water, evaluating the effects of different ozone concentrations and treatment durations. For instance, with an ozone concentration of 600 g/h, the initial concentration of ammonia decreased from 130 mg/L to 1 mg/L, almost completely eliminating ammonia. Additionally, nitrites were completely removed, and phosphates were fully broken down after 40 minutes of treatment.
Another key finding was the significant reduction in chemical oxygen demand (COD). Over 60 minutes, COD decreased by up to 70%, indicating efficient removal of organic pollutants from the water. Similarly, biochemical oxygen demand (BOD) levels also declined, reflecting the breakdown of organic matter caused by microorganisms. These data confirm the high efficiency of electrical discharge in decomposing organic substances.
The study also demonstrated a significant reduction in bacterial count. After the first 30 minutes, bacteria levels dropped by 85%, and after 60 minutes, they were completely eliminated. This indicates that ozone and hydroxyl radicals formed during electrical discharge play a critical role in disinfecting the water. Ozone production during the electrical discharge is the primary mechanism for bacteria elimination, making this method highly effective in sterilizing wastewater.
In terms of energy consumption, the method also proved to be efficient. For example, treating 1 liter of wastewater at 15 kV voltage consumed only 0.5 kWh of energy. This highlights the process as a low-energy, environmentally friendly technology for water purification. Furthermore, the method requires no chemical additives, demonstrating its ability to effectively remove pollutants without harming the environment.
Another advantage of this method is its versatility and flexibility. Wastewater treatment using electrical discharge can be applied to various types of wastewater, including industrial, household, and agricultural wastewater, indicating its wide application potential. The results showed that this method is effective even for the removal of hard-to-decompose pollutants, such as heavy metals, petroleum products, and organic substances.
The use of this method in wastewater treatment aligns with modern environmental standards. Currently, the technology is being used in many countries and plays a key role in enhancing environmental safety and protecting water resources. The method is also economically advantageous since it requires only electrical energy and no additional chemicals, making it cost-effective and environmentally sustainable. The method supports principles of sustainable development and efficient resource use.
This research confirms that the technology of generating ozone and hydroxyl radicals through electrical discharge is a modern and effective approach to wastewater treatment. The method efficiently removes heavy metals, organic pollutants, and bacteria, while consuming low amounts of energy and maintaining an environmentally friendly process. Furthermore, the potential for industrial-scale application of this method is being explored, as it could become a foundation for large-scale wastewater treatment in the future.
The results of this study indicate that the method has promising potential and could be widely used in future water purification processes. The technology of water purification through electrical discharge significantly contributes to ensuring environmental cleanliness, protecting human health, and preserving natural water resources.
REFERENCES
Saravanan, A., Kumar, P. S., Jeevanantham, S., Karishma, S., Tajsabreen, B., Yaashikaa, P. R., and Reshma, B., 2021.Effective water/wastewater treatment methodologies for toxic pollutants removal: Processes and applications towards sustainable development //Chemosphere.2021.Т. 280. С. 130595. https://doi. org/10.1016/j.chemosphere.2021 .130595
Gurreri, L., Tamburini, A., Cipollina, A., and Micale, G., 2020. Electrodialysis applications in wastewater treatment for environmental protection and resources recovery: A systematic review on progress and perspectives //Membranes. 2020. Т. 10. №. 7. С. Pp. 146. https: //doi.org/10.3390/membranes10070146
Kozhaspaev, N. K., Makanov, U., Bokanova, A. A., Abdykadyrov, A. A., Dagarbek, R., and Kodzhavergenova, A. K., 2016. Experience in application of ozonic technology for sewage treatment in the Kumkul region of Kazakhstan. Journal of Industrial Pollution Control, 2016, 32(2), страницы Pp.486–489.https:// www. icontrolpollution. com/ articles/experience-in-application-of-ozonic-technology-for-sewage-treatment-in-the-kumkul-region-of-kazakhstan.php?aid=79551
Cosgrove, W. J., and Loucks, D. P., 2015.Water management: Current and future challenges and research directions //Water Resources Research. 2015. Т. 51. №. 6. С. 4823-4839. Http s://doi.org/10.1002/2014WR016869
Abdykadyrov, A. A., Korovkin, N. V., Tashtai, E. T., Syrgabaev, I., Mamadiyarov, M. M., and Sunggat, M., 2021, March.Research of the process of disinfection and purification of drinking water using ETRO-02 plant based on high-frequency corona discharge. 2021 3rd International Youth Conference on Radio Electronics, Electrical and Power Engineering (REEPE). DOI: 10.1109/REEPE51337.2021.9388046. https://ieeexplore.ieee.org/docum ent/9388046
Abdykadyrov, A. A., Korovkin, N. V., Mamadiyarov, M. M., Tashtay, Y., and Domrachev, V. N., 2020, March.Practical Research of Efficiency of the Installation Etro-02 Ozonizer Based on the Corona Discharge. 2020 International Youth Conference on Radio Electronics, Electrical and Power Engineering (REEPE). DOI: 10.1109/ REEPE49198 .2020.9059150 https:// ieeexplore. ieee.org/document/9059150
Ahmed, S. F., Mofijur, M., Nuzhat, S., Chowdhury, A. T., Rafa, N., Uddin, M. A., Show, P. L., 2021. Recent developments in physical, biological, chemical, and hybrid treatment techniques for removing emerging contaminants from wastewater //Journal of hazardous materials. – 2021. – Т. 416. – С. 125912. https://doi.org/10.1016/j.jhazmat.2021.125912
Abdykadyrov, A., Marxuly, S., Mamadiyarov, M., Smailov, N., Zhunusov, K., Kuttybaeva, A., Orazbekov, A., 2023.Investigation of the Efficiency of the Ozonator in the Process of Water Purification Based on the Corona Discharge. J. Ecol. Eng. 2023; 24(2):140-151 DOI: https://doi.org/10.12911/22998993/156610 http://www.jeeng.net/Investigation-of-the-Efficiency-of-the-Ozonator-in-the-Process-of-Water-Purification,156610,0,2.html
Anpilov, A. M., Barkhudarov, E. M., Bark, Y. B., Zadiraka, Y. V., Christofi, M., Kozlov, Y. N., Temchin, S. M., 2001.Electric discharge in water as a source of UV radiation, ozone and hydrogen peroxide //Journal of Physics D: Applied Physics. 2001. Т. 34. №. 6. С. 993. DOI 10.1088/0022-3727/34/6/322
10. Chung, K. J., Lee, S. G., Hwang, Y. S., and Kim, C. Y., 2015.Modeling of pulsed spark discharge in water and its application to well cleaning //Current Applied Physics. 2015. Т. 15. №. 9. С. Pp. 977-986. https://doi.org/10.1016/j.cap.2015.05.010
Boyko, M. I., and Makogon, A. V., 2020.Gas bubble discharge options for disinfecting and cleaning water //Голова конференції: Сокол ЄІ (Україна). Співголови конференції: Торма А.(Угорщина), Раду СМ. 2020. С. 43.
Macedonio, F., Drioli, E., Gusev, A. A., Bardow, A., Semiat, R., and Kurihara, M. J. C. E., 2012. Efficient technologies for worldwide clean water supply //Chemical Engineering and Processing: Process
Intensification. 2012. Т. 51. С. 2-17. https://doi.org/10.1016/ j.cep.2011.09.011
Alkhadra, M. A., Su, X., Suss, M. E., Tian, H., Guyes, E. N., Shocron, A. N., Bazant, M. Z., 2022.Electrochemical methods for water purification, ion separations, and energy conversion //Chemical reviews. 2022. Т. 122. №. 16. С. Pp. 13547-13635. https://pubs.acs.org/doi/full/10.1021/acs.chemrev.1c00396
Jałowiecki, Ł., Borgulat, J., Strugała-Wilczek, A., Glaser, M., and Płaza, G., 2024.Searching of phenol-degrading bacteria in raw wastewater from underground coal gasification process as suitable candidates in bioaugmentation approach //Journal of Ecological Engineering. – 2024. – Т. 25. №. 2. DOI 10.12911/22998993/176143
Jaworek, A., Krupa, A., and Czech, T., 2007. Modern electrostatic devices and methods for exhaust gas cleaning: A brief review //Journal of electrostatics. 2007. Т. 65. №. 3. С. Pp. 133-155. https://doi.org/10.1016/j.elstat.2006.07.012
Abdykadyrov A. et al. Process of Determination of Surface Water by Ultraviolet Radiations. Water Conservation Management, 7(2): Pp. 158-167. http://doi.org/ 10.26480/wcm.02. 2023.158.167.https://www.watconman.org/archives-pdf/2wcm2023/2wcm2023-158-167.pdf
Abdykadyrov A. et al., 2023. Study of The Process of Cleaning Water-Containing Iron Solutions Using Ozone Technology. Water Conservation and Management, 7(2): 148-157. http://doi.org/10.26480/wcm.02.2023.148.157.https://www.watconman.org/archives-pdf/2wcm 2023/2wcm2023-148-157.pdf
Draginsky V. L., Alekseeva L. P., Samoilovich V. G, 2007. Ozonation in water purification processes. Moscow: Delhi Print, 2007. 190 p. ISBN: 978-5-94343-132-6
Romanovsky V. I., Lukhovitsky V. V., Gurinovich A.D., 2015. Investigation of the solubility of ozone in water by the height of the liquid column //The works of BSTU. No. 3. Chemistry and technology of inorganic substances. 2015. №. 3 (176). Pp. 113-118. https:// cyberleninka.ru/article/n/issledovanie-rastvorimosti-ozona-v-vode-po-vysote-stolba-zhidkosti/viewer

Pages 40-48
Year 2025
Issue 1
Volume 9

Download

Water Conservation and Management (WCM)

wcm.01.2025.22.30

HARNESSING SEAFOOD WASTE FOR SUSTAINABLE WASTEWATER TREATMENT: A COMPREHENSIVE REVIEW OF INNOVATIVE APPLICATIONS

Journal: Water Conservation and Management (WCM)
Author: Salem S. Abu Amr, Don Anton R. Balida, Riyad Mahfud, Motasem Y.D. Alazaiza
Print ISSN : 2523-5664
Online ISSN : 2523-5672

This is an open access article distributed under the Creative Commons Attribution License CC BY 4.0, which permits unrestricted use, distribution, and reproduction in any medium, provided the original work is properly cited

Doi: 10.26480/wcm.01.2025.22.30

Abstract

Seafood waste, an inevitable byproduct of the global seafood industry, poses considerable environmental challenges primarily because of improper disposal and the resultant release of methane during decomposition. However, recent studies have revealed its potential utility in wastewater treatment, presenting a sustainable and effective approach to pollutant removal. This review investigates the valorization of seafood waste, particularly focusing on chitosan derived from shrimp shells, fish scales and bones, which can serve both industrial and municipal wastewater treatment needs. Chitosan is well-known for its robust adsorption capacity; it efficiently eliminates heavy metals and organic pollutants (thanks to its unique chemical properties). Furthermore, fish scales, which are abundant in hydroxyapatite, exhibit remarkable efficacy in adsorbing toxic metals like lead and cadmium. The integration of these biomaterials into wastewater treatment technologies not only mitigates environmental burdens, but also aligns with the principles of a circular economy. Although promising, further research is necessary to improve the scalability and consistency of these materials for larger applications. This review emphasizes the essential function of seafood waste in promoting sustainable wastewater management; it contributes significantly to both environmental preservation and resource recovery. However, this issue is often overlooked, because many do not recognize its potential. While there are challenges associated with this approach, the benefits are substantial. The integration of seafood waste into waste management strategies can lead to innovative solutions, but further research is necessary to fully understand its impact.

Keywords

Seafood Waste, Wastewater Treatment, Chitosan, Heavy Metal Removal, Organic Pollutant Adsorption, Hydroxyapatite, Circular Economy

1. INTRODUCTION

The disposal of seafood waste emerges as an ever more pressing environmental challenge, particularly in light of the vast scale of the global seafood industry. Approximately 70 million metric tons of seafood waste are generated annually (Yan & Chen, 2015); this figure constitutes a significant fraction of the total seafood produced worldwide. This waste—encompassing fish scales, bones, and shells and assorted other by-products—is often discarded without sufficient consideration for its potential applications. However, recent studies have highlighted the value of seafood waste as a vital resource, especially within the domain of wastewater treatment. This paradigm shift in perception is crucial; it reflects a growing recognition of sustainability practices that can mitigate environmental impacts. Even though the industry has traditionally overlooked these by-products, innovative approaches are being explored, which could transform waste into valuable commodities.

The processing of seafood engenders a considerable quantity of organic waste, which, if inadequately managed, can precipitate dire environmental consequences. For instance, the decomposition of seafood waste in landfills generates methane—a potent greenhouse gas—thereby exacerbating climate change (Gómez-Estaca et al., 2018). Furthermore, leachate resulting from the mismanagement of seafood waste possesses the capacity to contaminate aquatic ecosystems, leading to eutrophication and other detrimental forms of water pollution (Zhu et al., 2020). However, while these concerns are indeed substantial, they also underscore the critical necessity of effectively addressing the management of seafood waste. This imperative is not merely a matter of environmental stewardship; it is an essential component of sustainable practices in the seafood industry.

In light of these formidable challenges, there exists an exigent necessity for sustainable waste management strategies capable of alleviating the environmental repercussions while simultaneously recovering valuable resources. The paradigm of waste valorization—wherein waste materials are transformed into economically advantageous products—has garnered considerable attention as a plausible methodology for effective waste management. Seafood waste, which is replete with bioactive compounds such as chitin, collagen and fish oils, presents a plethora of opportunities for valorization (Younes and Rinaudo, 2015). These compounds can be extracted and employed across a multitude of industrial applications, encompassing pharmaceuticals, food production and wastewater treatment.

Chitin, in particular, has been extensively investigated due to its potential efficacy in the removal of heavy metals and various pollutants from wastewater; this characteristic renders it a compelling and environmentally sustainable alternative to conventional treatment methodologies (Aliabadi et al., 2014). Both chitin and its derivative, chitosan—extracted from seafood waste—exhibit significant promise in the realm of wastewater treatment applications. These biopolymers serve as potent adsorbents for an array of pollutants, including heavy metals, dyes and organic compounds (Yang et al., 2009). However, the widespread implementation of these materials in treatment processes is still hindered by various factors, including cost and scalability. Thus, while the potential is immense, further research is needed to fully harness these resources effectively.

The implementation of these strategies, however, may encounter numerous challenges; this, nonetheless, does not diminish the potential benefits that could outweigh such obstacles. Although there remains a significant amount to learn, the future of waste valorization (which involves converting waste into valuable resources) appears exceptionally promising. This transformation is critical because it signifies a shift toward more sustainable practices, thus addressing both environmental and economic concerns.

The ability of chitin and chitosan to engage with various pollutants derives from their distinctive chemical architecture, characterized by the presence of amine and hydroxyl functional groups that facilitate adsorption. Furthermore, chitosan is not only biodegradable but also non-toxic; thus, it emerges as a sustainable alternative for environmental remediation (Younes & Rinaudo, 2015). In recent years, scholarly investigations have delved into the potential of chitosan-derived materials for the removal of heavy metals, such as cadmium, lead and arsenic, from industrial effluents. Research findings suggest that chitosan can effectively eradicate up to 99% of these contaminants under optimal conditions (Zamora-Sillero et al., 2018). Modifications to chitosan can enhance its adsorption capabilities—this enhancement can be realized through the integration of magnetic particles or various other functional groups (Yang et al., 2009). Such alterations have the capacity to improve the effectiveness of wastewater treatment methodologies; however, they simultaneously play a role in minimizing the environmental impact of industrial discharges.

Fish scales, which serve as a ubiquitous by-product of seafood processing, exhibit a remarkable abundance of hydroxyapatite—a naturally occurring mineralized form of calcium apatite. Hydroxyapatite has attracted considerable scholarly attention because of its potential efficacy in adsorbing heavy metals and diverse pollutants from wastewater (Anggresani et al., 2021). The intricate porous structure of fish scales, when combined with the extensive surface area of hydroxyapatite, facilitates the adept adsorption of contaminants. Numerous studies have demonstrated that fish scales can eradicate up to 95% of heavy metals, including lead and cadmium, from aqueous solutions (Aliabadi et al., 2014). However, in addition to their effectiveness against heavy metals, fish scales have also been shown to extract fluoride, a common pollutant in groundwater sources (Antoniac et al., 2015). The employment of fish scales in wastewater treatment offers a cost-effective and sustainable alternative to conventional methods, particularly in locales where fish processing represents a significant economic activity. This innovative repurposing of fish scales not only mitigates the issue of waste but also advances the principles of the circular economy, thereby enhancing the sustainable utilization of resources.

The application of seafood waste within the domain of wastewater treatment represents a promising and sustainable approach to addressing both environmental pollution and the myriad challenges associated with waste management. Valorizing seafood by-products (which include chitin, chitosan and fish scales), it becomes feasible to develop effective and environmentally conscious wastewater treatment technologies. However, additional research and development are essential to confront the challenges associated with the scalability and variability of these materials. Although ongoing innovation and investment are critical, the seafood industry may assume a pivotal role in promoting a circular economy and safeguarding our water resources for future generations. This industry constitutes a significant contributor to the global economy; yet, it simultaneously generates a substantial volume of waste, which encompasses fish scales, bones, shells and various other by-products. Because these wastes are not managed appropriately, they can engender serious environmental issues, including water pollution and the release of greenhouse gases.

Recent investigations have illuminated the prospective advantages of utilizing seafood waste (especially in the context of wastewater treatment) as a sustainable and efficacious approach for tackling environmental dilemmas. This review thoroughly explores the multifaceted applications of seafood waste in wastewater treatment, particularly highlighting the use of chitosan extracted from shrimp shells, fish scales and fish bones as biosorbents for the elimination of pollutants. The valorization of seafood waste for wastewater treatment represents a promising (and sustainable) strategy for addressing concerns associated with environmental pollution and waste management. Transforming waste materials such as shrimp shells, fish scales and fish bones into valuable biosorbents, the seafood industry can, indeed, mitigate its environmental impact while fostering a circular economy. However, it is crucial to acknowledge that further research and development are necessary to overcome prevailing challenges and fully harness the potential of these materials in large-scale applications for wastewater treatment. Although the initial findings are encouraging, the path forward requires a concerted effort to elucidate the complexities involved in the scalability of these innovative solutions. Because of this, a deeper understanding of the interactions between biosorbents and various pollutants will be vital in enhancing the effectiveness of wastewater treatment processes.

This review endeavors to explore the sustainable applications of seafood waste (particularly within the realm of wastewater treatment), emphasizing not solely the environmental advantages, but also the prospects for integration into a circular economy. However, it is imperative to consider the challenges that are inherent; although seafood waste presents valuable resources, its efficacious utilization is contingent upon numerous factors. This exploration will underscore innovative methodologies and the critical nature of collaboration among stakeholders, because tackling these issues can profoundly elevate sustainability initiatives.

2. METHODOLOGY

This investigation employs a qualitative research framework, primarily leveraging document analysis to scrutinize the extant literature regarding the utilization of seafood waste in wastewater treatment processes. The central aim is to dissect and synthesize findings derived from scientific inquiries, industry reports, policy documents and case studies, thereby facilitating a nuanced comprehension of the innovative applications of seafood waste—particularly chitosan and hydroxyapatite—in the realm of sustainable wastewater management. However, by concentrating on secondary sources, this study endeavors to furnish a thorough account of the methodologies employed in the application of these materials and their prospective viability for large-scale implementation. Granting the findings indicate significant potential, further exploration is warranted to fully elucidate their practicality in diverse contexts.

The process of data collection necessitated the meticulous identification and aggregation of a diverse array of pertinent secondary sources published within a specified temporal framework (insert time range). These sources encompassed peer-reviewed journal articles, as well as industry and governmental reports, technical standards, patents and conference proceedings. The search for relevant documents was executed utilizing academic databases such as Scopus, Web of Science and Google Scholar; key terms included “seafood waste,” “wastewater treatment,” “chitosan,” “hydroxyapatite,” “heavy metal removal,” and “sustainable resource recovery.” Moreover, grey literature—comprising industry white papers and governmental reports—was incorporated into the analysis to furnish a comprehensive perspective on the subject. However, the integration of such diverse materials posed challenges. This complexity was, in part, because the quality and relevance of each source varied significantly. While the endeavor aimed for thoroughness, it is essential to recognize that the synthesis of information from disparate origins can introduce biases and inconsistencies.

In the realm of data analysis, the document review was conducted through a thematic coding process. The documents selected were subjected to a systematic examination aimed at elucidating critical themes pertinent to seafood waste valorization. This examination specifically emphasized the transformation of shrimp shells, fish scales and bones into valuable materials such as chitosan and hydroxyapatite. Another salient theme pertained to the pollutant removal efficacy of these innovative materials; they demonstrated a remarkable capacity to adsorb both heavy metals and organic pollutants. However, the review also delved into sustainability and circular economy considerations associated with the utilization of seafood waste. Furthermore, it investigated how these materials are seamlessly integrated into existing wastewater treatment technologies. Challenges, limitations and opportunities for scaling these applications were thoughtfully evaluated, thereby providing a comprehensive perspective on the potential for large-scale implementation. Though the findings are promising, the complexities involved in actualizing these applications should not be underestimated, because they require meticulous planning and consideration of various environmental factors.

To guarantee both reliability and validity, a systematic (and transparent) methodology was employed throughout the document analysis process. Various sources were meticulously cross-verified to uphold consistency; peer-reviewed papers were prioritized to augment credibility. Iterative evaluations were conducted to refine the emergent themes, ensuring that the analysis accurately mirrored broader trends within the literature. Proper citation and acknowledgment of all sources were maintained to uphold academic integrity. Because the research relies exclusively on publicly available documents, ethical dilemmas such as those pertaining to human subjects or personal data were deemed irrelevant. However, considerable attention was devoted to properly crediting all sources to circumvent plagiarism. Although any review carries inherent limitations, this study may be restricted by the accessibility of recent research and data on seafood waste valorization in particular regions. Moreover, certain technologies discussed may still reside in experimental stages, with their scalability not yet fully elucidated in the literature—this represents potential avenues for future inquiry.

The systematic methodology employed in the examination of literature regarding seafood waste in wastewater treatment engenders a comprehensive and meticulous analysis. This approach not only offers insights into prevailing practices, but also illuminates prospective avenues for sustainable resource management. However, it is essential to recognize that the complexities inherent in this field necessitate a nuanced understanding of the interplay between current methodologies and future innovations. While challenges abound, the potential for improvement in waste management strategies is significant, because the implications for environmental sustainability are profound.

3. FINDINGS AND DISCUSSIONS

3.1 Composition of Seafood Waste

The waste generated from seafood primarily consists of fish bones, shrimp shells and various organic residues, each of which harbors valuable compounds that can be effectively harnessed in wastewater treatment processes. Fish bones, for instance, are notably enriched with calcium phosphate—a mineral celebrated for its exceptional adsorption capabilities, particularly in the removal of heavy metals from wastewater (Ogunola et al., 2018). Calcium phosphate serves an additional role as a coagulant, thereby enhancing the removal efficiency of suspended solids, phosphates and other pollutants present in wastewater (Ahmad et al., 2017).

On the contrary, shrimp shells primarily comprise chitin, a biopolymer that can be deacetylated to yield chitosan. This compound has garnered significant attention in scientific discourse, particularly because of its demonstrated efficacy in adsorbing heavy metals such as lead, cadmium and copper. This effectiveness is attributed to its high amino group content, which facilitates the binding of metal ions (Rinaudo, 2006). Moreover, chitosan possesses inherent flocculating properties, making it a promising eco-friendly alternative to synthetic flocculants in the treatment of both industrial and municipal wastewater (Mohan et al., 2006). Other constituents of seafood waste, including lipids and proteins, also present potential advantages in the realm of wastewater treatment, although their roles remain less explored.

The utilization of organic materials as carbon sources within biological treatment processes serves to enhance microbial activity, thereby facilitating the degradation of organic pollutants (Yang et al., 2020). For instance, research conducted revealed that calcium phosphate, derived from piscine skeletal remains, could effectively sequester fluoride ions from industrial effluent, achieving removal efficiencies approaching 85% by (Ahmad et al., 2017). Similarly, emphasized the efficacy of chitosan in the extraction of dyes and heavy metals from textile wastewater, thereby underscoring its remarkable versatility in addressing a myriad of industrial effluents (Rinaudo, 2006). Seafood waste—primarily composed of fish bones, shrimp shells and various organic residues—presents a considerable environmental challenge, primarily because of the substantial quantities produced by the global seafood sector. However, these by-products are replete with valuable compounds, including calcium phosphate, chitin, chitosan, proteins and lipids; this rich composition holds significant potential for application in wastewater treatment initiatives.

The valorization of waste materials serves not only to enhance waste management practices; it also provides sustainable solutions for the treatment of various types of industrial and municipal wastewater. Fish bones constitute a substantial fraction of seafood waste, representing a significant portion of the discarded material generated during fish processing activities. These bones are primarily made up of calcium phosphate, specifically in the form of hydroxyapatite (Ca₅(PO₄)₃(OH)), which is recognized as the mineral form of calcium apatite. Hydroxyapatite demonstrates remarkable efficacy in adsorbing heavy metals from aqueous solutions, largely attributable to its high surface area and the presence of phosphate groups capable of binding metal ions. Furthermore, the process of deacetylation of chitin to yield chitosan notably increases its solubility in acidic solutions, rendering it an effective adsorbent for pollutants such as Direct Blue-86 (DB-86), a common dye employed within the textile industry. In a study conducted chitosan derived from shrimp shells was utilized to effectively remove DB-86 from aqueous solutions by (Fat’hi and Ahmadi, 2016). However, the implications of these findings extend beyond mere waste management, because they suggest potential avenues for environmental remediation and resource recovery.

The investigation elucidated that chitosan could accomplish nearly 100% dye elimination under optimal conditions; however, the efficacy of the adsorption process is markedly contingent upon several variables, including pH, adsorbent dosage and contact time. The Langmuir isotherm model was ascertained to align well with the adsorption data, thereby indicating that chitosan exhibits a significant affinity for DB-86. This characteristic renders it a promising candidate for dye removal in wastewater treatment scenarios.

Fish scales, another plentiful by-product of seafood processing, have also been scrutinized for their prospective utility in wastewater treatment. These scales are predominantly constituted of collagen and hydroxyapatite, both of which have been demonstrated to possess commendable adsorptive capabilities. Studies have shown that fish scales can effectively eliminate a diverse array of pollutants from wastewater, encompassing heavy metals, ammonia and essential nutrients such as nitrate and phosphate (Subhashree et al., 2020). Moreover, executed a study aimed at evaluating the efficacy of fish scales as biosorbents for treating wastewater originating from seafood processing facilities (Devasena et al., 2020).

The findings indicated that fish scales possess the capacity to induce substantial reductions in biological oxygen demand (BOD), chemical oxygen demand (COD) and ammonia concentrations within wastewater. This research also revealed that fish scales effectively eliminate over 70% of nitrites and phosphates, underscoring their promise as a cost-efficient and environmentally sustainable remedy for wastewater treatment in the seafood sector. Fish bones, which are abundant in hydroxyapatite, represent another significant by-product with potential applications in wastewater management. Hydroxyapatite, a naturally occurring mineral variant of calcium apatite, is distinguished by its proficiency in adsorbing heavy metals from aqueous solutions. Consequently, fish bones emerge as an optimal material for the extraction of hazardous metals such as lead, cadmium and arsenic from industrial effluents. Shrimp shells, a further crucial element of seafood waste, are characterized by their richness in chitin—a biopolymer amenable to chemical processing for the synthesis of chitosan. Although chitin ranks as the second most prevalent natural polymer subsequent to cellulose, it is predominantly constituted of N-acetylglucosamine units.

Chitosan, the deacetylated derivative of chitin, is extensively utilized in wastewater treatment because of its distinctive properties, which encompass biocompatibility, biodegradability and a pronounced adsorption capacity for diverse pollutants (Rinaudo, 2006). However, beyond traditional sources such as fish bones and shrimp shells, seafood waste encompasses a myriad of organic residues, including but not limited to fish skin, scales and viscera; these materials are notably rich in proteins, lipids and various organic compounds.

While these substances have been investigated for their potential in augmenting biological wastewater treatment processes, fish scales, for instance, contain collagen—a protein that can be hydrolyzed into peptides and amino acids. These resultant compounds serve as vital carbon sources for microorganisms within biological treatment systems, thereby enhancing the degradation of organic pollutants (Arvanitoyannis and Kassaveti, 2008). This collagen hydrolysate derived from fish scales has demonstrated efficacy in improving the performance of activated sludge processes, as it fosters microbial growth and activity, ultimately leading to a more effective removal of organic matter from wastewater. Furthermore, lipids extracted from fish waste, particularly fish oil, have also come under scrutiny for their significant role in biological treatment methodologies.

In the realm of anaerobic digestion processes, lipids undergo a transformation into volatile fatty acids, which function as vital substrates for methanogenic bacteria. This biological interaction ultimately culminates in the production of biogas (primarily methane). However, the efficiency of this conversion is contingent upon various factors, including temperature and microbial community composition. While the potential for biogas production is significant, challenges remain in optimizing these processes, because the dynamics of microbial interactions can be complex. Thus, understanding the nuances of lipid conversion is essential for enhancing biogas yield and sustainability. Table 1 presents a summary for different materials extracted from seafood waste used for wastewater treatment.

3.2 Applications in Wastewater Treatment

Adsorption Processes

The application of hydroxyapatite derived from fish bones in wastewater treatment has been the subject of extensive investigation. For instance, numerous studies have demonstrated its efficacy in the elimination of heavy metals, including lead, cadmium and arsenic, from contaminated aqueous environments (Reddy et al., 2017). In a particular study, fish bone powder was utilized as an adsorbent for industrial wastewater containing lead ions, achieving a remarkable removal efficiency exceeding 90% (Nguyen et al., 2019). This success can be attributed to the ion exchange mechanism occurring between the calcium present in hydroxyapatite and the heavy metals within the wastewater, which leads to the formation of stable metal-phosphate complexes.

Furthermore, beyond the removal of heavy metals, calcium phosphate derived from fish bones has been employed to extract fluoride from industrial effluents. indicated that fish bone-derived calcium phosphate could effectively adsorb fluoride ions, with removal efficiencies reaching as high as 85% (Ahmad et al., 2017). The capacity of fish bones to facilitate fluoride removal is primarily due to their propensity to undergo ion exchange reactions with fluoride ions, resulting in the formation of insoluble calcium fluoride precipitates. However, the predominant function of chitosan in wastewater treatment remains the removal of heavy metals, revealing a crucial intersection in the methodologies employed for the purification of contaminated water.

Chitosan’s amino groups (-NH₂) exhibit a pronounced affinity for metal ions, thereby establishing it as an efficacious adsorbent for various metals including lead, copper, nickel and mercury (Wan Ngah and Hanafiah, 2008). The underlying mechanism is predicated upon the chelation of metal ions by these amino groups, which results in the formation of stable complexes that can be readily extracted from aqueous environments. For instance, research conducted elucidated that chitosan could effectively eliminate over 90% of copper and lead ions from synthetic wastewater, thereby underscoring its considerable potential in industrial contexts by (Crini and Badot, 2008). In addition to its adsorptive capabilities, chitosan is employed as a flocculant in wastewater treatment processes. This is primarily due to its cationic nature, which enables it to neutralize the negative charges present on colloidal particles in wastewater. Thus, this interaction leads to the aggregation of these particles into larger flocs, which can subsequently be removed through sedimentation or filtration (Renault et al., 2009). However, this flocculating property renders chitosan a viable alternative to synthetic flocculants, which are often characterized by their non-biodegradable and toxic nature. Furthermore, chitosan has found application in the remediation of dye-contaminated wastewater.

Dyes originating from the textile industry constitute a significant environmental pollutant; however, the adsorption properties of chitosan render it effective for the removal of such organic compounds. For example, chitosan beads have been employed to adsorb reactive dyes from aqueous solutions, achieving substantial removal efficiencies—this is largely due to the formation of hydrogen bonds and electrostatic interactions between the dye molecules and the chitosan (Chiou et al., 2004). Seafood waste, especially shellfish shells derived from shrimp, crabs and oysters, merits attention as a valuable resource in wastewater treatment processes. The primary component of these shells, known as chitin, can be transformed into chitosan, a biopolymer with a multitude of applications in wastewater management. Chitosan is renowned for its high adsorption capacity, which makes it particularly efficacious in eliminating heavy metals, dyes and various other pollutants from wastewater (Viera et al., 2021). Moreover, its biodegradability and non-toxic nature enhance its attractiveness as an environmentally sustainable treatment option (Rinaudo, 2006). Several studies have substantiated the efficacy of chitosan in diverse wastewater treatment methodologies, thus underscoring its potential in addressing pressing environmental concerns.

The study demonstrated that chitosan, derived from crab shells, effectively eliminated copper ions from industrial wastewater, achieving an impressive removal efficiency exceeding 90% (Nomanbhay and Palanisamy, 2005). However, the exploration of seafood waste for biosorption has garnered significant attention; specifically, the biological components within this waste are employed to absorb and concentrate pollutants from aqueous environments. The efficacy of these materials in the extraction of heavy metals, such as lead and cadmium, has been comprehensively documented (Ngah and Hanafiah, 2008). Furthermore, seafood waste can be repurposed as a substrate in microbial fuel cells (MFCs)—bioelectrochemical systems that convert organic matter present in wastewater into electrical energy. This organic content serves as a vital fuel source for the bacteria within MFCs, thus facilitating the dual process of wastewater treatment and renewable energy generation (Pant et al., 2010). In an investigation centered on fish bones for heavy metal remediation, the adsorptive capacity of hydroxyapatite was scrutinized, revealing its remarkable effectiveness in binding metal ions from contaminated water. Nevertheless, the implications of these findings extend beyond immediate applications, as they underscore the potential of integrating waste materials into sustainable environmental practices.

The investigation revealed that fish bones possess the capacity to eliminate as much as 95% of heavy metals from wastewater under optimal conditions; this indicates their potential as a sustainable and economically viable alternative to synthetic adsorbents in wastewater treatment (Devasena et al., 2020). However, while the incorporation of seafood waste into wastewater treatment presents numerous advantages, several challenges must be surmounted in order to optimize these methodologies for large-scale implementation. One principal challenge lies in the variability inherent in the composition of seafood waste, which can significantly impact the consistency and efficacy of the treatment processes. Furthermore, the scalability of these technologies warrants thorough evaluation, particularly in areas characterized by limited resources and inadequate infrastructure. Future inquiries should prioritize the development of standardized methodologies for the extraction and modification of biopolymers such as chitosan, because optimizing the conditions for the utilization of fish scales and bones in wastewater treatment is imperative.

Moreover, the investigation into the integration of these materials with alternative sustainable technologies—such as biochar production and microbial bioreactors—holds the promise to significantly augment the overall efficiency and sustainability of wastewater treatment processes (Fat’hi and Ahmadi, 2016; Subhashree et al., 2020). However, it is essential to consider the implications of such combinations, because their effectiveness may vary depending on numerous factors. This complexity necessitates a thorough analysis, although initial findings are promising.

3.3 Applications as Coagulants

The utilization of seafood waste materials, notably shrimp shells, has garnered significant scholarly attention as efficacious coagulants in the realm of wastewater treatment. This is attributable to their prevalent availability and rich biopolymer composition, which includes chitin and chitosan. Such materials exhibit remarkable effectiveness in the remediation of contaminants, including turbidity, organic matter and suspended solids. For instance, research indicates that shrimp waste has been successfully employed in surface water treatment, achieving an impressive 95% reduction in turbidity and an 80% decrease in organic matter at optimal pH levels and coagulant dosages (Frantz et al., 2020). Furthermore, the deproteinized variants of seafood waste manifest promising outcomes in bio-coagulation processes pertinent to industrial wastewater—particularly from abattoirs—where chitosan-protein combinations have been shown to remove up to 97.35% of biochemical oxygen demand (BOD) and 90.73% of chemical oxygen demand (COD) (Okey-Onyesolu et al., 2023). These investigations underscore the potential for seafood waste to serve as sustainable and environmentally friendly alternatives to traditional coagulants. However, ongoing research is necessary to fully elucidate the mechanisms underlying these processes and to optimize the application of such materials in diverse wastewater treatment scenarios.

Table 3 delineates a series of investigations concerning wastewater treatment modalities utilizing biocoagulants, biosurfactants and chitosan-based materials. Frantz et al. (2020) scrutinized the application of shrimp waste (SW, DMSW, DPSW and chitin) as biocoagulants within the context of surface wastewater treatment. They achieved a remarkable 95% turbidity removal and an 80% reduction in organic matter, specifically at a pH of 6, with a dosage of 200 mg/L. Gaur et al. (2022), on the other hand, illuminated the efficacy of biosurfactants in augmenting petroleum hydrocarbon solubility. Their findings indicated a 47% emulsification efficiency and a striking 2.34-fold enhancement in solubility across a spectrum of pH levels (2-13), temperatures (25–121°C) and salt concentrations (2%–17% NaCl). Abbasi (2021) provided insights into the use of chitosan for coagulation-flocculation in fish production wastewater (FPW), reporting an impressive removal efficacy of TSS ranging from 70% to 90% and BOD between 83% and 84% at a pH of 10, with a coagulant dosage of 3-9 mL. Furthermore, Okey-Onyesolu et al. (2023) ventured into bio-coagulation utilizing chitosan-protein in abattoir wastewater, revealing high removal rates for BOD (97.35%), COD (90.73%), turbidity (94.71%) and color (99.07%) at a pH of 2-4, employing an adsorbent dosage of 2-3 g and a settling time of 25-35 minutes. In a preceding investigation, Okey-Onyesolu et al.

In the year (2020), the study achieved an impressive 92% in total suspended solids (TSS) and 85% in biochemical oxygen demand (BOD) removal from abattoir wastewater. This remarkable outcome was accomplished using 1.5 grams of chitosan-protein at a pH level of 2, maintained at a temperature of 20°C. However, it is essential to note that the efficacy of such treatments can vary significantly depending on numerous variables. The settling time was set at 35 minutes, which, although seemingly brief, proved effective in facilitating the removal process. Because of these findings, further exploration into the optimization of these parameters could yield even greater results.

3.4 Applications as Biosorption Processes

A particularly significant application of seafood waste in the domain of wastewater treatment involves the utilization of chitosan, a biopolymer derived from chitin—found within the exoskeletons of crustaceans such as shrimp and crabs. Chitosan has undergone extensive examination (Rinaudo, 2006) for its remarkable capacity to adsorb heavy metals, dyes and various pollutants from wastewater. This study revealed that, under optimal pH conditions, the removal efficiency for copper surpassed 90%, thereby underscoring its potential as a natural and biodegradable adsorbent. Furthermore, the application of fish scales, which are abundant in collagen, offers another compelling avenue for addressing dye-contaminated wastewater. Specifically, research conducted by Arivoli and Thenkuzhali (2008) demonstrated that fish scales can effectively eliminate methylene blue dye from wastewater, attaining removal efficiencies as high as 98%. The porous architecture of the fish scales, combined with their extensive surface area, facilitates the adsorption of substantial quantities of dye molecules, rendering them a viable alternative to synthetic adsorbents. However, further exploration is warranted to fully comprehend the implications of these natural materials in wastewater treatment processes.

Crustacean exoskeletons, abundant in chitin and calcium carbonate, have emerged as a pivotal resource in biosorption methodologies aimed at the extraction of heavy metals and various contaminants from effluent streams. A seminal investigation conducted by Bhatnagar and Sillanpää (2009) offered an extensive critique of biosorption techniques employing crustacean shells. The authors elucidated that the substantial chitin content and expansive surface area of these shells confer a distinct advantage in the adsorption of heavy metals, including lead, zinc and chromium. Their findings indicated that the efficacy of crustacean shells in eliminating lead from aqueous solutions could reach an impressive 92%, contingent upon variables such as the initial concentration and pH level of the solution. Furthermore, an exploration by Guo et al. (2010) examined the efficacy of crab shells in the biosorption of dyes from textile wastewater. The results substantiated that crab shells could achieve a remarkable 85% removal of Congo red dye at an optimal pH of 4.5. The researchers concluded that the biosorption capacity of crab shells is modulated by several factors, namely contact time, initial dye concentration and pH. This investigation not only underscores the promise of crustacean shells as a sustainable material for wastewater remediation but also highlights their significance within the textile sector, thereby positioning them as a viable alternative in environmental management strategies.

Challenges and Future Prospects

Although the potential applications of seafood waste in the realm of wastewater treatment are promising, several formidable challenges persist. The variability inherent in the composition of seafood waste—dependent on factors such as species, processing methodologies and geographic origins—can significantly impact the consistency and efficacy of these materials within treatment processes. The extraction and processing of valuable compounds (such as chitosan) from seafood waste are often complex and costly endeavors; this complexity can limit their widespread implementation in large-scale wastewater treatment facilities. However, ongoing research endeavors are focused on optimizing extraction processes, as well as enhancing the efficiency of materials derived from seafood waste in wastewater treatment. For instance, enzymatic and microbial methods are currently being explored to improve both the yield and quality of chitosan extracted from shrimp shells. This exploration may lead to reductions in production costs and environmental impacts (Kurita, 2006). Furthermore, the integration of seafood waste-derived materials into hybrid treatment systems, which combine physical, chemical and biological methodologies, has the potential to enhance overall treatment efficiency and sustainability.

The employment of seafood waste in wastewater treatment embodies a sustainable method for tackling both waste management and water pollution dilemmas. Leveraging the distinctive attributes of fish bones, shrimp shells and various organic residues (which are often overlooked), industries can formulate effective and eco-friendly treatment solutions. This not only contributes to environmental protection but also aids in resource conservation. However, one must consider the complexities involved in the implementation of such strategies, because they require careful planning and execution. Although challenges exist, the potential benefits are significant, thus warranting further exploration and development in this field.

4. CONCLUSION

The valorization of seafood waste represents a sustainable (and eco-friendly) methodology for tackling the environmental challenges engendered by the global seafood industry. This review elucidates the potential of seafood byproducts—such as chitosan, sourced from shrimp shells and hydroxyapatite, obtained from fish scales and bones—in wastewater treatment applications. These biopolymers exhibit remarkable efficiency in adsorbing heavy metals, dyes and various other pollutants from industrial effluents; thus, offering an alternative to traditional treatment methods. Chitosan’s biodegradability and non-toxic nature render it an exemplary candidate for sustainable wastewater management. Furthermore, fish scales and bones contribute significantly to pollution control due to their effective adsorption properties. However, despite these promising results, challenges related to the variability of seafood waste composition and the scalability of the technologies remain. Continued research and innovation are vital (because they enhance the extraction processes, improve the consistency of materials and explore cost-effective methods for large-scale deployment). Although progress has been made, overcoming these obstacles is essential for realizing the full potential of seafood waste valorization. Through the integration of seafood
waste into wastewater treatment systems, industries can significantly contribute to a circular economy while simultaneously reducing environmental impact. This practice not only promotes resource recovery, but also represents a pivotal step towards more sustainable methodologies. While the utilization of such waste materials may seem unconventional, it serves to safeguard water resources and foster longterm environmental sustainability. However, the successful implementation of this approach requires careful consideration of various factors, including technological advancements and regulatory frameworks, because these elements are crucial for optimizing the efficacy of wastewater treatment processes.

ACKNOWLEDGEMENT
The authors express their heartfelt appreciation to the numerous individuals and organizations who generously supported this study. They would like to thank the International College of Engineering and Management (ICEM) in the Sultanate of Oman and the Ministry of Higher education and research innovation (MOHERI) under the block funding research grant No. MOHERI/BFP/ICEM/2023-24/01

REFERENCES

Abali, M., Ait Ichou, A., Zaghloul, A., Sinan, F., and Zerbet, M., 2020. Removal of nitrate ions by adsorption onto micro-particles of shrimp-shells waste: Application to wastewater of infiltration-percolation process of the city of Agadir (Morocco). Materials Today: Proceedings, 37, 3898–3904. https://doi.org/10.1016/j.matpr.2020.08.486

Abbasi, I., 2021, November 25. A liquid chitosan-based biocoagulant for treating wastewater from fish processing plants. AzoMaterials. https://www.azom.com/article.aspx?ArticleID=20908

Ahmad, Z., El-Khaiary, M. I., and Algothami, M. S., 2017. Fluoride removal from water using calcium phosphate-based adsorbents: A review. Journal of Environmental Chemical Engineering, 5 (6), Pp. 5067-5084. https://doi.org/10.1016/j.jece.2017.09.001

Ahmad, Z., El-Khaiary, M. I., and Algothami, M. S., 2017. Fluoride removal from water using calcium phosphate-based adsorbents: A review. Journal of Environmental Chemical Engineering, 5(6), Pp. 5067-5084. https://doi.org/10.1016/j.jece.2017.09.001

Aliabadi, M., Irani, M., Ismaeili, J., and Najafzadeh, S., 2014. Design and evaluation of chitosan/hydroxyapatite composite nanofiber membrane for the removal of heavy metal ions from aqueous solution. Journal of the Taiwan Institute of Chemical Engineers, 45(2), Pp. 518-526. https://doi.org/10.1016/j.jtice.2013.08.005

Andreazza, R., Heylmann, K. K. A., Cadaval Junior, T. R. S., Quadro, M. S., Pieniz, S., Camargo, F. A. de O., & Afonso, T. F. (2019). Copper adsorption by different extracts of shrimp chitin. Desalination and Water Treatment, 141, 220-228. https://doi.org/10.5004/dwt.2019.24098

Anggresani, L., Sari, Y. N., and Rahmadevi, R., 2021. Hydroxyapatite (HAp) from tenggiri fish bones as abrasive material in toothpaste formula. Jurnal Kimia Valensi, 1 (1), Pp. 1-9.

Antoniac, V. I., Lesci, I. G., Blajan, A. I., and Vitioanu, G., 2015. Bioceramics and biocomposites from marine sources. In Key Engineering Materials, Vol. 672, Pp. 276-292. Trans Tech Publications Ltd.

Arivoli, S., and Thenkuzhali, M., 2008. Adsorption of Methylene Blue onto a Low-Cost Carbon Prepared from Natural Plant Material. *Journal of Environmental Science and Engineering, 50 (1), Pp. 21-28.

Arvanitoyannis, I. S., and Kassaveti, A., 2008. Fish industry waste: Treatments, environmental impacts, current and potential uses. International Journal of Food Science & Technology, 43 (3), Pp. 726-745. https://doi.org/10.1111/j.1365-2621.2006.01504.x

Bhatnagar, A., and Sillanpää, M., 2009. Applications of chitin- and chitosan-derivatives for the detoxification of water and wastewater: A short review. Advances in Colloid and Interface Science, 152 (1-2), Pp. 26-38. https://doi.org/10.1016/j.cis.2009.09.003

Chang, J., Shen, Z., Hu, X., Schulman, E., Cui, C., Guo, Q., and Tian, H., 2020. Adsorption of tetracycline by shrimp shell waste from aqueous solutions: Adsorption isotherm, kinetics modeling, and mechanism. ACS Publications, 5, Pp. 2467-3477. https://doi.org/10.1021/acsomega.0c00450

Chiou, M. S., Ho, P. Y., and Li, H. Y., 2004. Adsorption of anionic dyes in acid solutions using chemically cross-linked chitosan beads. Dyes and Pigments, 60 (1), Pp. 69-84. https://doi.org/10.1016/j.dyepig.2003.07.013

Crini, G., and Badot, P. M., 2008. Application of chitosan, a natural aminopolysaccharide, for dye removal from aqueous solutions by adsorption processes using batch studies: A review of recent literature. Progress in Polymer Science, 33 (4), Pp. 399-447. https://doi.org/10.1016/j. progpolymsci.2007.11.001

Devasena, S. S., Padmavathy, P., Manimekalai, D., and Shakila, R. J., 2020. Assessment of fish scale biosorbent in the treatment of seafood processing plant wastewater. Journal of Chemical Technology and Biotechnology, 96 (3), Pp. 723–731. https://doi.org/10.1002/jctb.6548

Devasena, S. S., Padmavathy, P., Manimekalaic, D., and Shakilad, R. J., 2020. Assessment of fish scale biosorbent in the treatment of seafood processing plant wastewater. Journal of Chemical Technology and Biotechnology, 96(3), Pp. 723-731. https://doi.org/10.1002/jctb.6585

Fabbricino, M., and Pontoni, L., 2016. Use of non-treated shrimp-shells for textile dye removal from wastewater. Journal of Environmental Chemical Engineering, 4 (4), Pp. 4100-4106. https://doi.org/10.1016/j.jece.2016.09.002

Fat’hi, M. R., and Ahmadi, A., 2016. Dye removal from wastewater using shrimp chitosan as an eco-friendly adsorbent. International Journal of Environmental Health Engineering, 5 (2), Pp. 1-5. https://doi.org/10.4103/2277-9183.180001

Frantz, T. S., de Farias, B. S., Leite, V. R. M., Kessler, F., Cadaval Jr, T. R. S., and de Almeida Pinto, L. A., 2020. Preparation of new biocoagulants by shrimp waste and its application in coagulation-flocculation processes. Journal of Cleaner Production, 269, 122397. https://doi.org/10.1016/j.jclepro.2020.122397

Gaur, V. K., Gupta, P., Tripathi, V., Thakur, R. S., Regar, R. K., Patel, D. K., and Manickam, N., 2022. Valorization of agro-industrial waste for rhamnolipid production, its role in crude oil solubilization and resensitizing bacterial pathogens. Environmental Technology & Innovation, 25, Pp. 102-108. https://doi.org/10.1016/j.eti.2021.102108

Gómez-Estaca, J., López-de-Dicastillo, C., Hernández-Muñoz, P., Catalá, R., and Gavara, R. (2018). Advances in antioxidant active food packaging. Trends in Food Science & Technology, 17 (6), Pp. 240-248. https://doi.org/10.1016/j.tifs.2006.12.022

Guo, J., Li, C., and Liu, X., 2010. Removal of Congo red by crab shell waste from textile wastewater. Journal of Environmental Management, 91 (12), Pp. 3036-3042. https://doi.org/ 10.1016/j.jenvman.2010.08.015

Kurita, K., 2006. Chitin and chitosan: Functional biopolymers from marine crustaceans. Marine Biotechnology, 8 (3), Pp. 203-226. https://doi.org/10.1007/s10126-005-0097-5

Lukum, A., Paramata, Y., Botutihe, D. N., Akume, J., Sukamto, K., and Paramata, A. R., 2020. Development of bioadsorbent chitosan from shrimp shell waste to mercury absorption efficiency. IOP Conference Series: Earth and Environmental Science. https://doi.org/10.1088/1755-1315/484/1/012093

Madrid, J., Ibarra-Zatarain, Z., Viera-Pérez, J. E., Campos-Espinoza, A., and Peña-Messina, E., 2022. Effect of the shrimp farming wastes as co-feed on growth performance and digestibility of juvenile grey mullet, Mugil cephalus. Latin American Journal of Aquatic Research, 50(1), Pp. 39-49. https://doi.org/10.3856/vol50-issue1-fulltext-2861

Mohan, D., Pittman, C. U., and Steele, P. H., 2006. Pyrolysis of wood/biomass for bio-oil: A critical review. Energy & Fuels, 20(3), Pp. 848-889. https://doi.org/10.1021/ef0502397

Nainggolan, K. N., Putra, Y. P., and Fitriyani, E., 2024. Shrimp digestive bacteria performance for shrimp waste chitin extraction. Biology, Medicine, and Natural Product Chemistry, 13 (1), Pp. 183-191. https://doi.org/10.32746/bmnpc.v13i1.909

Ngah, W. S. W., and Hanafiah, M. A. K. M., 2008. Removal of heavy metal ions from wastewater by chemically modified plant wastes as adsorbents: A review. Bioresource Technology, 99(10), Pp. 3935-3948.https://doi.org/ 10.1016/ j.biortech.2007.06.011

Nguyen, T. A. H., Ngo, H. H., Guo, W. S., Zhang, J., Liang, S., Lee, D. J., Nguyen, P. D., and Bui, X. T., 2019. Modification of agricultural waste/by-products for enhanced phosphate removal and recovery: Potential and obstacles. Bioresource Technology, 280, Pp. 478-492. https://doi.org/10.1016/j.biortech.2019.01.151

Nomanbhay, S. M., and Palanisamy, K., 2005. Removal of heavy metal from industrial wastewater using chitosan coated oil palm shell charcoal. Electronic Journal of Biotechnology, 8 (1), Pp. 43-53. https://doi.org/10.2225/vol8-issue1-fulltext-7

Novalina Nainggolan, K., Perdana Putra, Y., and Fitriyani, E., 2024. Shrimp digestive bacteria performance for shrimp waste chitin extraction. Biology, Medicine, & Natural Product Chemistry, 13 (1), Pp. 183-191. https://doi.org/10.32746/bmnpc.v13i1.909

Ogunola, O. S., Onada, O. A., and Falaye, A. E., 2018. Mitigating the environmental impact of plastic wastes in Nigeria: A review. Waste Management & Research, 36(4), Pp. 315-329. https://doi.org/10.1177/0734242X18758265

Okey-Onyesolu, C. F., Chukwuma, E. C., Okoye, C. C., and Umobi, C. O., 2023. Application of fish bone chitosan-protein bio-coagulant for abattoir wastewater treatment: Comparative process optimization and evaluation. Waste Management Bulletin, 1, Pp. 49-59. https://doi.org/10.1016/j.wmab.2022.12.003

Okey-Onyesolu, C. F., Chukwuma, E. C., Okoye, C. C., and Umobi, C. O., 2023. Application of fish bone chitosan-protein bio-coagulant for abattoir wastewater treatment: Comparative process optimization and evaluation. Waste Management Bulletin, 1(1), Pp. 49-59. https://doi.org/10.1016/j.wmbl.2023.06.005

Pant, D., Van Bogaert, G., Diels, L., and Vanbroekhoven, K., 2010. A review of the substrates used in microbial fuel cells (MFCs) for sustainable energy production. *Bioresource Technology, 101(6), Pp. 1533-1543. https://doi.org/10.1016/ j.biortech. 2009.10.017

Ramadhani, P., Chaidir, Z., Tomi, Z. B., and Rahmiarti, D., 2020. Shrimp shell (Metapenaeus monoceros) waste as a low-cost adsorbent for metanil yellow dye removal in aqueous solution. Desalination and Water Treatment, 197, Pp. 413-423. https://doi.org/10.5004/dwt.2020.26071

Reddy, D. H. K., Seshaiah, K., and Reddy, A. V. R., 2017. Removal of heavy metals from aqueous solutions by adsorption: A review. Journal of Environmental Management, 181, Pp. 327-336. https://doi.org/10.1016/j.jenvman.2016.10.059

Renault, F., Sancey, B., Badot, P. M., and Crini, G., 2009. Chitosan for coagulation/flocculation processes: An eco-friendly approach. European Polymer Journal, 45 (5), Pp. 1337-1348. https://doi.org/10.1016/j.eurpolymj.

Rinaudo, M., 2006. Chitin and chitosan: Properties and applications. Progress in Polymer Science, 31(7), Pp. 603-632. https://doi.org/10.1016/j.progpolymsci.2006.06.001

Sajjadi Shourije, S. M. J., Dehghan, P., Bahrololoom, M. E., Cobley, A. J., Vitry, V., Azar, G. T. P., Kamyab, H., and Mesbah, M., 2023. Using fish scales as a new biosorbent for adsorption of nickel and copper ions from wastewater and investigating the effects of electric and magnetic fields on the adsorption process. Chemosphere, 317, Pp. 137-829. https:// doi.org/ 10.1016/ j.chemosphere.2023.137829

Salawu, O. A., Han, Z., and Adeleye, A. S., 2022. Shrimp waste-derived porous carbon adsorbent: Performance, mechanism, and application of machine learning. Journal of Hazardous Materials, 437, Pp. 129-266. https://doi.org/10.1016/j.jhazmat.2022.129266

Shourije, S. M. J. S., Dehghan, P., Bahrololoom, M. E., Cobley, A. J., Vitry, V., Azar, G. T. P., Kamyab, H., and Mesbah, M., 2023. Using fish scales as a new biosorbent for adsorption of nickel and copper ions from wastewater and investigating the effects of electric and magnetic fields on the adsorption process. Chemosphere, 317, Pp. 137-829. https:// doi.org/ 10.1016/ j.chemosphere. 2023.137829

Stepnowski, P., Olafsson, G., Helgason, H., and Jastorff, B., 2004. Recovery of astaxanthin from seafood wastewater utilizing fish scales waste. Chemosphere, 54, Pp. 413-417. https://doi.org/10.1016/j.chemosphere.2003.09.010

Subhashree Devasena, S., Padmavathy, P., Manimekalai, D., and Shakila, R. J., 2020. Assessment of fish scale biosorbent in the treatment of seafood processing plant wastewater. *Journal of Chemical Technology and Biotechnology, 96*(3), Pp. 723-731. https://doi.org/10.1002/jctb.6548

Subhashree, S., Padmavathy, P., Manimekalaic, D., and Shakilad, R. J., 2020. Fish scales for wastewater treatment: A comprehensive review. Journal of Chemical Technology and Biotechnology, 96(3), Pp. 723-731. https://doi.org/10.1002/jctb.6585

Trung, T. S., Minh, N. C., Cuong, H. N., Phuong, P. T. D., Dat, P. A., Nam, P. V., and Hoa, N. V., 2022. Valorization of fish and shrimp wastes to nano-hydroxyapatite/chitosan biocomposite for wastewater treatment. Journal of Science: Advanced Materials and Devices, 7, Pp. 100-485. https://doi.org/10.1016/j.jsamd.2022.100485

Viera, C., Marques, A., Chaveiro, N., Santos, L., and Amorim, M. T. P., 2021. Chitosan and chitosan derivatives—A promising structure of bioactive compounds. Marine Drugs, 19 (8), Pp. 431. https://doi.org/10.3390/md19080431

Yan, N., and Chen, X., 2015. Sustainability: Don’t waste seafood waste. Nature, 524 (7564), 155. https://doi.org/10.1038/524155a

Yang, H., Yuan, B., Lu, Y., and Cheng, R., 2009. Preparation of magnetic chitosan microspheres and its applications in wastewater treatment. *Science China Chemistry, 52 (3), Pp. 249-256. https://doi.org/10.1007/s11426-009-0052-6

Yang, Q., Zeng, Z., Chen, M., Li, Y., and Hu, L., 2020. Advances in enhanced treatment of petroleum refinery wastewater by functional materials: A review. Journal of Cleaner Production, 255, 120262. https://doi.org/10.1016/j.jclepro.2020.120262

Yang, Y., Foong, S. Y., He, Y., Liew, R. K., Ma, N. L., Yek, P. N. Y., Ge, S., Naushad, M., and Lam, S. S., 2024. Upcycling crab shell waste into bio

Zamora-Sillero, J., Gharsallaoui, A., and Prentice, C., 2018. Peptides from fish by-product protein hydrolysates and its functional properties: An overview. *Marine Biotechnology, 20 (2), Pp.118-130. https://doi.org/10.1007/s10126-018-9816-8

Zhu, Z., Zhang, B., Cai, Q., Ling, J., Lee, K., and Chen, B., 2020. Fish waste based lipopeptide production and the potential application as a bio-dispersant for oil spill control. Frontiers in Bioengineering and Biotechnology, 8, Pp. 734. https://doi.org/10.3389/ fbioe. 2020.00734

Pages 22-30
Year 2025
Issue 1
Volume 9

Download

Water Conservation and Management (WCM)

wcm.01.2025.18.21

STUDY OF MOBILE FORMS OF MANGANESE IN THE WATERS OF SMALL RIVERS OF OUTER MANCHURIA ON THE EXAMPLE OF WATERCOURSES DRAINING THE TERRITORY OF KHABAROVSK AND ITS VICINITIES.

Journal: Water Conservation and Management (WCM)
Author: Kaminsky Oleg, Makarevich Konstantin, Sinkova Irina, Khomchenko Olga, Andreeva Diana, Burkova Anna, Kirichenko Evgeny
Print ISSN : 2523-5664
Online ISSN : 2523-5672

This is an open access article distributed under the Creative Commons Attribution License CC BY 4.0, which permits unrestricted use, distribution, and reproduction in any medium, provided the original work is properly cited

Doi: 10.26480/wcm.01.2025.18.21

Abstract

The manuscript is devoted to the study of manganese content in small rivers of Outer Manchuria (on the example of the city of Khabarovsk and its surroundings), as well as the factors determining the content of this element in water. Sixteen watercourses were studied, and in 11 of them the natural manganese background was exceeded by a factor of 10-130 (i.e. 110-1320 μg/l on average). The comparison of the obtained data with the geochemical peculiarities of this area allows us to assume that the source of manganese intake may be iron-manganese nodules and products of their hydrolytic destruction. The influence of the permanganate index on manganese release is separated into spatial and temporal dynamics. As a result, the maximum of the manganese release process appears to be shifted relative to the time and place of permanganate index increase. An informative hydrochemical indicator for assessing the risk of release of toxic concentrations of manganese is the fraction of ammonium nitrogen. Each additional 15-20% NH3 corresponds to an increase in Mn concentration of 120 μg/l. This trend continues between 40 and 80% of the ammonium fraction and can result in the release of up to 480 μg/l Mn. Further increases in the NH3 fraction can lead to a release of Mn up to 1320 μg/l. This indicates the possibility of formation of new migration routes of this element initiated by anthropogenic impact on the territory of this region.

Keywords

Manganese, small rivers, urban areas, ammonium nitrogen, permanganate index

1. INTRODUCTION

As is known, transition metal ions are an integral component of the natural composition of the natural background characteristic of both surface and ground waters. For normal metabolic processes of many organisms it is necessary to regularly receive some optimal dose of these transition metals from the environment. Such transition metals are considered to be essential elements. Their intake is necessary both for normal course of repair processes in tissues and for growth and development of the organism as a whole. Manganese is an important element for metabolic processes of the human body. This element, for example, is necessary for the formation of arginase and glutamine synthetase. Such an important antioxidant mitochondrial enzyme as superoxide dismutase also requires manganese for its formation (Furbee and Dobbs, 2009). Manganese enters organisms mainly in the ionic form Mn2+.

Although manganese is an essential element, it is dangerous to human health in high levels. Manganese overdose is dangerous because of its neurotoxicity. For example, receiving high doses of manganese in childhood can cause the development of pathologies of the nervous system (Grandjean and Landrigan, 2014). The World Health Organisation has established a maximum manganese concentration of 0.1 mg/l for water supply systems (Usepa, 2004).

Manganese is an element with variable valence. In natural biogeocenoses and geological formations, conditions leading to the formation of manganese (II) and manganese (IV) compounds are mainly formed Recently, some researchers have paid attention to manganese (III) compounds, which are metastable in aqueous solutions but relatively stable when incorporated into minerals (Ma et al., 2023; Shi et al., 2020; Oldham et al. 2017).

Manganese occurs naturally in many surface waters and groundwater sources, as well as in soils that are eroded by these waters. However, human activities are also responsible for large amounts of manganese contamination of water in some areas. Manganese (II) enters the body mainly with food and drinking water, so its regular monitoring in such facilities is important (Crapnell and Banks 2022). Experimental studies and computer modelling show that dissolved Mn is very mobile and less prone to complexation compared to other trace elements such as Cu, Co, Ni, Pb or Zn (Abbasse et al., 2022; Charriau et al., 2011; Morgan, 2000).

Manganese is an example of a metal for which the influence of the content of organic pollutants on its migration activity is particularly significant. This is due to the fact that it actively participates in the redox hydrochemical processes with the organic component of pollution and dissolved oxygen in water, as a result of which it can be transferred from bottom sediments to the mobile ionic form Mn2+. Thus, due to reductive processes, manganese can be released from the fixed state and further migrate in water bodies for considerable distances.

For surface fresh waters the background manganese content is 10-50 μg/l. For waters of Khabarovsk city territories, the increased natural background manganese 200-300 μg/l is characteristic, not seldom it is registered up to 2000 μg/l, and in underground waters up to 8000 μg/l. This is due to the fact that the territory of Khabarovsk is part of the province of iron-manganese fresh waters (Kulakov 2013; Novikov et al., 2008). High manganese in waters is due to the presence of ironmanganese nodules of soils and the lower part of the Pliocene clay strata in the territory of outer Manchuria (Kulakov, 2013). Most literature data on manganese migration contain studies conducted for much smaller concentration ranges, the upper limit of which does not exceed 40 μg/l
(Superville et al., 2018). As a result, the conclusions on the behaviour of various forms of manganese obtained in such studies cannot be correctly transferred to water bodies for which the concentration range is characterized by much larger values with an upper limit of 5000-8000 μg/l, typical for the waters of Outer Manchuria.

2. MATERIAL AND METHODS

The territory of Khabarovsk and its vicinity is drained by 16 of the largest small rivers (Figure 1). These rivers are characterized by different anthropogenic impacts. Some rivers (12-16) flow through protected areas and have no anthropogenic influence. Some rivers have significant anthropogenic influence (1,3) (Shesterkin et al., 2021; Sinkova, et al., 2024).

The chemical composition of water was determined in the laboratory of the Collective Use Centre of the IWEP FEB RAS using standard methods (D, 2012). Sampling was carried out in accordance with regulatory documents (Gost, 2012; Gost, 2022; RD, 1996) in the period 2021-2024. The concentration of mobile manganese was determined using Agilent Technologies atomic absorption spectrometer: SpectrAA 240 FS AA.

3. RESULTS AND DISCUSSIONS

All studied samples were divided into 11 size groups depending on their manganese content. Accordingly, samples containing Mn from 0 to 120 μg/l were assigned to the size group (I), samples containing Mn from 120 to 240 μg/l were assigned to the size group (II). The remaining size groups were formed accordingly with 120 μg/l discretization, up to size group (XI). The distribution curve of samples by size groups is shown in Figure 2A. It can be clearly seen that the first four groups account for the major proportion (77.9%) of all samples. The distribution obtained does not have a clearly defined maximum. The maximums occur in size group (I) and group (III), accounting for 23.6 and 24.0%, respectively. The rest of the obtained data set accounts for 22.1% of the total samples collected. The results of these samples are relatively evenly distributed among the remaining size groups from (V) to (XI).

The obtained data indicate that, despite the absence of anthropogenic (industrial) sources of manganese in the majority of samples, the background values of this element are exceeded. At that, the first 3 size groups account for the main part of the sample (77.9%). For the rest of the samples exceeding the natural background is from 50 to 130 times.

In order to assess the degree of influence of permanganate index value and reducing hydrochemical environment on manganese content, the data on permanganate index and the share of nitrogen attributable to its reduced form (NH3) were compared with the manganese size group distribution described above. This comparison allowed the ranges of influence of both factors on manganese content to be identified. The results are presented in Figure 2 B, C. The dots show the permanganate index values and the fraction of ammonium form of nitrogen in the samples for each of the size groups.

As can be seen in Figure 2B, manganese in the concentration range 0-120 μg/l was observed in a very wide range of NH3 fraction values. The average value is 37.4%, while the median value is slightly lower at 30.9%. In samples containing 120-240 μg/l manganese, the proportion of reduced forms of nitrogen is more than 15%. The average value of 54.5%, as well as the median value of 50.6%. This indicates that a more pronounced reducing environment is required to release such concentrations of manganese.

The same trend was observed for samples containing 240-360 μg/l manganese. The minimum recorded fraction of ammonium nitrogen also slightly increases – 24%, and the average value is 75.8% (with a median of 85.6%).

Thus, analyzing the data on the first three size groups we can say that the increase in the intensity of reductive hydrochemical processes (estimated by the content of reduced forms of nitrogen) leads to an increase in manganese content. On average, an increase in the intensity of reductive processes corresponding to an increase in the proportion of ammonium nitrogen by every 15-20% led to an increase in manganese concentration by 120 μg each time.

The group of samples containing from 360-480 μg/l is characterised by the fact that the median value for it retains the previously described trend and increases up to 97.57%, while the average value remains close to the previous group.

Further analysis of the curve shows that in a hydrochemical environment in which the ammonium nitrogen content is more than 85% manganese between 480 and 1320 μg/l can be expected to be present. As can be seen from Figure 2A, the remaining samples were relatively evenly distributed between the remaining size groups up to and including XI.

Thus, the increase in the content of nitrogen in the reduced form can mark the growth of manganese concentration in the range up to 600 μg/l. At the same time, there is a pronounced trend for an increase in the average and median values of the ammonium form of nitrogen with increasing manganese concentration.

Ammonium ion is only a marker of formation of reductive hydrochemical atmosphere, but cannot act as a reducing agent for Mn. As is known, high concentrations of Mn in watercourses are formed: firstly, in anaerobic conditions characteristic of groundwater (Kulakov, 2013); secondly, at high concentrations of organic matter forming reducing conditions. Permanganate index was used to estimate the concentration of such organic matter. The data on the relationship between permanganate index and manganese concentration groups are presented in Figure 2C. As can be seen from the graph there is a moderately pronounced trend of increasing manganese concentrations from the mean permanganate index values in the first four size ranges (up to 480 μg/l). For the other
size groups (from 480 μg/l), the permanganate index values range from 11 to 13 mg/l O2. It should be noted that high concentrations of manganese are not associated with the highest of the recorded
permanganate index values. Probably, this fact is related to the fact that the influence of permanganate index on manganese release is dispersed in spatial and temporal dynamics. As a result, the maximum of the manganese release process appears to be shifted relative to the time and place of permanganate index increase, which induced this process.

The dynamics of changes in manganese concentrations in the bed of the Chernaya River (Figure 3A) made it possible to assess the impact of permanganate index on this value in one watercourse along the length of the channel. This river is characterized by a length of 32 km, draining areas with low anthropogenic influence 0-2.2 km, with agricultural enterprises and private farms 5.2-8.6 km and an area with minimal anthropogenic influence outside the city.

As can be seen from the graph (Figure 3A), of the seven sampling points, two are upstream of the effluent discharge point (points 0 km and 2.2 km) and the remaining five are downstream, respectively. Points 4.8 and 5.2 km are characterized by the maximum values of permanganate index, the value of which increases by a factor of 3. At the same time, there is an increase in the share of ammonium nitrogen up to 94%. Oxygen content decreases 2 times. The content of manganese, on the contrary, increases by more than 2 times. However, the highest concentration of manganese is registered not in this section of the river, but further downstream. The next sampling point, 8.6 km, is characterized by the most pronounced reductive hydrochemical environment: oxygen concentration is minimal and it is spent on oxidation of compounds that determine the magnitude
of permanganate index. Additional release of manganese occurs, but its highest concentration is recorded downstream. At 19.7 km, the permanganate index decreases to almost baseline values (see points 0 and 2.2 km), oxygenation is restored and ammonia nitrogen levels decrease. The manganese content reaches its maximum concentration. At the last point 31.8 km of the sampling route, all hydrochemical parameters are restored to their initial values, but the manganese content does not change significantly and remains close to the maximum values recorded for this sample series. Thus, the manganese concentration does not decrease despite the restoration of the previous level of water oxygenation and the formation of an oxidising hydrochemical environment in which there are no reduced forms of nitrogen and the permanganate index content is close to the initial values for this watercourse.

4. CONCLUSIONS

The study of manganese content in small rivers of the outer Manchuria (on the example of Khabarovsk city) showed an excess of natural background manganese from 10 to 130 times (which is on average 100 – 1320 μg/l). This is a consequence of manganese release from the products of hydrolytic destruction of iron-manganese nodules.

It is shown that the most informative hydrochemical indicator to assess the degree of expression of reductive processes leading to the release of manganese is the share of low valence forms of nitrogen (NH3) from the total content of inorganic nitrogen (NTotal). It is shown that the increase in the share of ammonium nitrogen for every 15-20% leads to the release of 120 μg/l of manganese. This trend is maintained between 40 and 80% of the ammonium fraction and can lead to the release of up to 480 μg/l Mn. A fraction greater than 80% results in the release of up to 1320 μg/l Mn.

High manganese concentrations are not confined to the highest reported permanganate index values. This fact is probably due to the fact that the effect of permanganate index on manganese release is separated in spatial and temporal dynamics. As a result, the maximum of the manganese release process appears to be shifted relative to the time and place of permanganate index increase, which induced this process.

ACKNOWLEDGMENT

The research was funded by the grant Russian Science Foundation № 24-17-20002, https://rscf.ru/project/24-17-20002/ and contracts with the Government of Khabarovsk Region agreement № 100C/ 2024

REFERENCES

Abbasse, G., Ouddane, B., Fischer, J.C., 2002. Determination of total and labile fraction of metals in seawater using solid phase extraction and inductively coupled plasma atomic emission spectrometry (ICP-AES). J. Anal. At. Spectrom. 17, Pp. 1354–1358. https://doi.org/10.1039/B203407G

Charriau, A., Lesven, L., Gao, Y., Leermakers, M., Baeyens, W., Ouddane, B., Billon, G., 2011. Trace metal behaviour in riverine sediments: role of organic matter and sulfides. Appl. Geochem. 26:80–90. https://doi.org/10.1016/j.apgeochem.2010.11.005

Crapnell, R.D., Banks, C.E., 2022. Electroanalytical overview: The determination of manganese. Sensors and Actuators Reports. 4,100110, ISSN 2666-0539.https://doi.org/10.1016/j.snr.2022.100110.

D 52.24.353-2012 ‘Sampling of land surface water and treated wastewater’

Furbee, B., Dobbs, M.R., 2009. CHAPTER 26 – manganese. Clinical Neurotoxicology. W.B. Saunders, Philadelphia. Pp. 293 – 301. https://doi.org/10.1016/B978-032305260-3.50032-0

GOST 31861-2012. Water. General requirements for sampling, (from 01.01.2023 GOST R 59024-2020).

GOST 17.1.5.05-85 ‘Hydrosphere. General requirements for sampling of surface and sea waters, ice and atmospheric precipitation’ (from 01.01.2023 GOST R 70282-2022).

Grandjean, P., Landrigan, P.J., 2014. Neurobehavioural effects of developmental toxicity. Lancet Neurol. 13, Pp. 330 – 338. http://dx.doi.org/10.1016/S1474-4422(13)70278-3

Kulakov, V.V., 2013. Use of in-situ purification of groundwater from iron and manganese (on the example of water supply of Khabarovsk). Vestnik FEB RAS. 2013

Ma, A., Huang, Y., Mao, S., Li, S., Zhu, Z., Li, M., Liu, H., 2023. “Mn(II) Curtain” in the riparian sediment at the lower reaches of the Hanjiang River, China. Journal of Hydrology. 625, A, 130047, 0022-1694.10.1016/j.jhydrol.2023.130047

Morgan, J.J., 2000. Manganese in natural waters and earth’s crust: its availability to organisms. Metal Ions in Biological Systems. Manganese and Its Role in Biological Processes. 37

Novikov, V.M., Shkolnik, E.L., Zhegallo, E.A., Orleansky, V.K., 2008. Features of formation of hypergenic iron-manganese nodules (Russian Far East, Vietnam). Pacific Geology. 27, 5, 53-64.

Oldham, V.E., Mucci, A., Tebo, B.M., Luther, G.W., 2017 Soluble Mn(III)–L complexes are abundant in oxygenated waters and stabilized by humic ligands. Geochimica et Cosmochimica Acta. 199, 238-246, ISSN 0016-7037. https://doi.org/10.1016/j.gca. 2016.11.043

RD 52.18.595-96 ‘Federal list of measurement techniques allowed for use when carrying out works in the field of environmental pollution monitoring’.

Usepa, 2004. Drinking Water Health Advisory for Manganese. U.S. Environ. Prot. Agency Off. Water Washington, DC EPA-822-R-04-003. 2004, Pp. 1 – 49. doi:EPA- 822-R-04-003

Shesterkin, V. P., Sinkova, I. S., Kaminsky, O. I., 2021. Dynamics of the Content of Mineral Forms of Nitrogen in the Water of Small Rivers in Khabarovsk during the Winter Period. Journal of Ecological Engineering. 22, 10, Pp. 121-126. DOI 10.12911/ 22998993/142120

Shi, C., Bangjing, D., Yunbin, Q., Zhihao, C., Zhengkui L., 2020. Nitrogen loss through anaerobic ammonium oxidation mediated by Mn(IV)-oxide reduction from agricultural drainage ditches into Jiuli River, Taihu Lake Basin. Science of The Total Environment. 700, 134512, ISSN 0048-9697. https://doi.org/10.1016/j.scitotenv.2019.134512

Sinkova, I.S., Shesterkin, V.P., Shesterkina, N.M., Makarevich, K.S., Kaminsky, O.I., 2024. Anthropogenic influence on the chemical composition of water of small rivers of Khabarovsk in winter low water. Geography and Natural Resources. 45, 3, Pp. 91-97. DOI 10.15372/GIPR20240309. EDN HFPIUC

Superville, P. J., Ivanovsky, A., Bhurtun, P., Prygiel, J., Billon, G., 2018. Diel cycles of reduced manganese and their season alvariability in the Marque River (northern France). Science of The Total Environment. 624, Pp. 918-925 https://doi.org/10.1016/j.scitotenv. 2017. 12.189

Pages 18-21
Year 2025
Issue 1
Volume 9

Download

Water Conservation and Management (WCM)

wcm.04.2024.495.500

EXPLORING WATER QUALITY AS A DETERMINANT OF THE EXISTENCE OF SOFT SHELL CRAB (SCYLLA OLIVACEA) IN DIFFERENT HABITATS OF THE LARGE MARINE ECOSYSTEM IN THE BAY OF BENGAL.

Journal: Water Conservation and Management (WCM)
Md. Jahidul Hasan, Mohammad Bodrul Munir, Adriyana Syazwani Ayuni Supian, Roslianah Asdari, Sheikh Tanvir Akhter, Md. Shoebul Islam, Rabina Akther Lima
Print ISSN : 2523-5664
Online ISSN : 2523-5672

This is an open access article distributed under the Creative Commons Attribution License CC BY 4.0, which permits unrestricted use, distribution, and reproduction in any medium, provided the original work is properly cited

Doi: 10.26480/wcm.04.2024.495.500

Abstract

The present study determined the concentration of semicarbazide (SEM) in water and soil samples from diverse habitats of mud crabs encompassing natural breeding grounds, mangrove-associated rivers, different commercial farms and the tissue samples in soft-shell crabs. Semicarbazide is a residue of banned veterinary drug nitrofurazone that can be found in some natural crustaceans that have never been exposed to nitrofurazone. Analysis of water and soil sediment confirmed the presence of SEM in natural habitat, however the concentrations was very low as <0.1 ng/g throughout the study. The extraction and analysis of nitrofuran metabolites was conducted by using liquid chromatography-tandem mass spectrometry (LC-MS/MS) methods. The commercial farms of mud crabs were also exhibited the lowest levels of SEM in both water (0.0003 ng/g) and soil sediment (0.0005 ng/g). Tissue-specific SEM analyses encompassing muscle, shell-muscle composite, and shell revealed a distinct spatial gradient in which shell tissues exhibiting the highest concentration of SEM (3.51±0.03 ng/g) in commercial farms, surpassing those observed in muscle tissues (0.33±0.01 ng/g). Remarkably, crabs from commercial farms exhibited higher SEM concentrations across all tissue types compared to those from natural breeding grounds. However, no SEM was detected in crab feed snail and tilapia fish in commercial farms, suggesting feed composition may not be a major contributor. The lowest concentrations of SEM in water and soil sediments towards physiological processes rather than environmental contamination as the source. This study highlights limitations of SEM as a sole nitrofuran abuse marker, advocating for broader regulatory frameworks and calls for reevaluating regulations to ensure public health and responsible aquaculture.

Keywords

Semicarbazide, Soft-Shell Crabs, Orange mud crab, Aquaculture, Nitrofuran Metabolite

1. INTRODUCTION

Mud crabs, also known as mangrove crabs, belong to the family Portunidae under Scylla genus (1). They are one of the prospective and high value crustaceans that are numerous in the muddy bottoms of brackish water near the coast, mangrove areas, and river mouths (Soegianto et al., 2022). Crustacean and several marine decapods were captured from wild habitat were reported to contain Semicarbazide (SEM) in their tissues (Zhang et al., 2016). The SEM can be occurred naturally in wild crustaceans even that have never been exposed to nitrofurans metabolites (Rairat et al., 2024). The SEM can also be detected in river water and soill sediments of the mangrove ecosystem. Nitrofurans are broad-spectrum antibacterial drugs that were widely used as aquaculture and veterinary medicine (Points, J., Burns, D.T., Walker, M.J., 2015). The uses of SEM is currently prohibited worldwide in farmed animals, including aquaculture species because of their possible carcinogenicity properties (Stadler et al., 2004). Semicarbazide has been identified as a natural component in some wild crustaceans has garnered attention due to its presence as a protein-bound metabolite associated with the banned nitrofuran nitrofurazone (Rairat et al., 2024). SEM encompasses its status as a thermal decomposition product of azodicarbonamide, previously employed as a blowing agent in plastic sealing gaskets and as a flour additive to enhance flour quality (Stadler et al., 2004). This compound has been identified as a reliable marker for illicit practices in aquaculture and poses potential risks to both environmental ecosystems and human health (Pipoyan et al., 2023). The historical application of nitrofurans as broad-spectrum antimicrobial agents represented a transformative chapter in the domains of human and veterinary medicine, offering effective control against infectious diseases (Zuma et al., 2019). However, the promising trajectory of these compounds was abruptly altered by concerns regarding potential carcinogenicity. The global response to the potential health risks associated with nitrofurans prompted their formal prohibition in food-producing animals across the European Union, instigating a pivotal shift in global agricultural practices. As early as July 1, 1993, the European Union initiated a formal ban on nitrofurans in all food-producing animals, an action that predated the official establishment of the European Union in November 1993 (Benford et al., 2015) .The global prohibition extended across major agricultural nations, such as the United States, China, Korea, Japan, and Thailand, reflecting a shared commitment to safeguarding public health and ensuring food safety integrity (Rairat et al., 2024).

As nitrofurans, including SEM, are classified as prohibited substances, the establishment of maximum residue limits (MRL) becomes a challenge (Valera-Tarifa et al., 2013). The European Union, in response, introduced minimum required performance limits (MRPL) as reference points for action (RPA) in 2003, with subsequent adjustments, including a new RPA of 0.5 ng/g starting on November 28, 2022 (Commission Regulation, 2019). However, recognizing the potential natural occurrence of SEM in crayfish, the European Union stipulates that the RPA for SEM in crayfish will be enforced only when the illegal use of nitrofurazone (NFZ) or SEM has been established. This necessitates the confirmation of at least one of the other nitrofuran metabolites, adding layers of complexity to the regulatory framework.

Various wild crustaceans have shown evidence of SEM’s natural occurrence in prior research. Notable instances include crayfish giant river prawn (M. rosenbergii) (McCracken, 2013) , and oriental river prawn (M. nipponense) and several marine decapods (Zhang et al., 2015; Huizhen et al., 2023; Li et al., 2021; Hui-Juan et al., 2012). Within this context, crabs (S. olivacea) serve as a noteworthy subject for investigation, given their role as a vital link in the aquatic food chain, their ecological importance, and their economic significance in regions such as Bangladesh (Saari and Peltonen, 2004). Investigations into mud crab (Scylla sp.) shells have reported SEM levels in diverse geographic locations and capture contexts. Specifically, wild-caught specimens in Belgium exhibited concentrations ranging from 94.12 to 12.6 ng/g (Van Poucke et al., 2011). The analysis commercial samples in China reported 81.8 ng/g and wild-caught specimens in Thailand showcased levels between 1.65 and 22.75 ng/g (Rairat, 2024; Van Poucke et al., 2011; Hui-Juan, 2012). Furthermore, a study revealed SEM concentrations in wild caught crab muscle ranging from 0.13 to 0.40 ng/g in Thailand (Rairat et al., 2024). Despite this breadth of research, there remains a conspicuous gap in the literature pertaining to SEM levels in soft shell crabs sourced from either natural habitats or commercial farms, thereby necessitating further investigation to discern the origins of SEM contamination in this specific crustacean species. Despite the widespread concern over the potential health risks associated with nitrofurans and their metabolites, a comprehensive examination of SEM in the context of soft-shell crabs in Bangladesh is notably absent from the existing body of literature. The study aimed to unfolds against the backdrop of the distinct spatial variations of shaping SEM concentrations in soft-shell crabs (S. olivacea). By offering a holistic perspective, this research seeks to contribute significantly to understanding SEM dynamics in water and soil sediments of mud crabs breeding grounds, and mangrove-associated rivers of mangrove ecosystem including the shell and tissue of mud crab populations.

2. MATERIALS AND METHODS

2.1 Collection of Water and Soil Sediment Samples

Samples were meticulously gathered from natural breeding grounds in the Bay of Bengal, different rivers in mangrove areas, and three soft shell crab farming companies in the Khulna and Satkhira districts (Figure 1). Water and soil sediment samples were randomly collected from three different locations at 0.5 km distance of each site. The samples were then mixed homogenously and prepared a composite sample (Santos-Fernández et al., 2015. Water samples were collected from 2–3 feet below the surface level and sediment samples were collected from up to 20 cm depth of soil sediments by using sampling tubes (Boncompagni et al., 2003; Boncompagni et al., 2003; Hannan et al., 2024). The selected samples were intended to represent the diverse habitats and aquaculture practices associated with wild habitat and soft shell crab production within the specified regions. All collected samples were sent to an accredited Quality Control Laboratory in Khulna, where liquid chromatography coupled with mass spectrometry (MS) was utilized to detect and quantify semicarbazides. Ethical guidelines and regulations were strictly followed to ensure compliance with standards.

2.2 Water Quality Assessment

Dissolved oxygen (DO), temperature, pH, salinity, total alkalinity, and ammonia contents of the pond water were measured between 9.00 and 10:00 am after seven-day intervals. The water quality parameters of the breeding ground and different location of rivers at Sundarbans mangrove region were conducted by using potable instruments. Salinity was measured using a transportable refractometer (ATAGO). A common centigrade thermometer was used to measure the surface water’s temperature. A digital multimeter (HQ 40d digital multimeter, HACH) was used to record the water’s pH and dissolved oxygen levels. Titrimetric analysis was utilized to calculate the total alkalinity (APHA, 2000). An ammonia test kit (HANNA) was used to determine the ammonia nitrogen level.

2.3 Collection of Mud Crab Samples

Mud crab samples were collected from all sampling sites by maintaining hygienic conditions. All samples of mud crabs (S. olivacea) were transported to the laboratory in a frozen state and subsequently stored at -20 °C prior to analysis. Individual crabs were thawed, and the exoskeleton was carefully removed. The tail meat of each crab was then minced using a food blender before being subjected to analysis. Simultaneously, the corresponding shells of each crab were separated, dried overnight at 60 °C, and subsequently cooled to room temperature. The dried shells were finely ground using a pestle and mortar to obtain a homogeneous sample for further analysis. This meticulous sample treatment process ensured the preparation of both muscle and exoskeleton samples for subsequent assessments of semicarbazide content (Zhang et al., 2015). The choice of these sample treatment steps aimed to provide accurate and representative data on the presence of contaminants in soft shell crab samples.

2.4 Extraction and Analysis of SEM from Water, Soil Sediments and Crabs

SEM analysis was done according to the procedure of (Cooper et al., 2005). The extraction procedure for analyzing nitrofuran metabolites via liquid chromatography-tandem mass spectrometry (LC-MS/MS) involved weighing 1.00 ± 0.05 g portions for soil and soft-shell crab (S. olivacea) meat and 1.00 ± 0.05 ml for water. Samples and known negative tissue were taken into 50 ml centrifuge tubes for subsequent matrix blank and spiked recovery samples. Protein precipitation was achieved by adding 8 ml cold methanol, vortexing for 1 minute, and centrifuging at 4000 rpm for 4 minutes, with subsequent methanol discarding and a repeat using 4 ml methanol. Chemical treatment follows, incorporating 5 ml of 0.2 M HCl and 50 µl of nitrobenzaldehyde, along with the addition of 200 µl of 10 ng/ml d5-AMOZ and 100 µl of the 10 ng/ml working spiking standard to recovery tubes. Incubation occurred at 37 ± 2 °C for 16 ± 2 hours, emphasizing light avoidance. Neutralization was accomplished by adding 500 µl of 0.3 M KH2PO4 to each tube and adjusting to pH 7.0 ± 0.5 with 1 M NaOH solution. Extraction involved the addition of 4 ml ethyl acetate, vortexing, centrifugation at 4000 rpm for 8 minutes, and combining organic layers through repeated extractions. Evaporation to near dryness under nitrogen at 45°C was followed by reconstitution with 1 ml 50% methanol, vortexing, filtration through a 0.45 µm syringe filter, and collection in a vial. The resulting derivatives were subjected to LC–MS/MS analysis using an Acquity UPLC (R) BEH C18 column (1.7 µm, 2.1×100 mm) on an A10UPH2878 LC system (Waters Singapore) coupled with a QBB 933 triple quadrupole mass spectrometer (Waters UK) operating in positive electrospray mode. The chromatographic separation and mass spectrometric analysis facilitated the identification and quantification of SEM. AMOZ-d5 is carried through the analytical procedure to compensate for any analyte loss and for ion suppression during the MS stage. Results were calculated against standard curves, and concentrations were expressed as nanograms per gram (ng/g) wet weight of soft-shell crab meat and shell, ensuring a comprehensive assessment of SEM content using advanced analytical techniques.

2.5 Statistical Analysis

The Statistical Package for the Social Sciences, Version 25 (SPSS, Chicago, IL, USA) was used to compute basic descriptive statistics, such as minimum, maximum, mean, and standard error for every location and treatment. Boxplot analysis was performed using R version 4.2.2. The statistical significance between the experimental groups by one-way ANOVA (Mann Whitney U test) was also performed using SPSS, and a 95% significance level was considered. The Duncans Multiple Range Test (DMRT) was employed to examine the disparity in means among different location with respect to the standard error of the mean (SEM) within both water and bottom soil environment.

3. RESULTS

3.1 Water Quality Parameters

Water quality was evaluated during the sampling process in the wild to elucidate the natural aquatic conditions pertinent to crab habitats. The resultant water quality metrics are presented in Table 1. Salinity levels ranged from 16 to 23 ppt, indicative of an estuarine water environment. The pH measurements fell within the range of 7.5 to 8.10, denoting a slightly alkaline condition. Furthermore, water temperatures were recorded between 18 to 22 ℃, while dissolved oxygen concentrations exceeded 6 mgL-1. The total dissolved solids (TDS) exhibited a range between 3919 to 4554 mg/L, while conductivity ranged from 7034 to 9324 µS/cm. Hardness measurements fell within the range of 2978 to 5650 mg/L.

Note: BG=Breeding ground, RV=River; Values in the parenthesis indicate the range of the parameters.

3.2 Spatial Occurrence of SEM in Mud Crabs

The spatial occurrence and concentration of crab muscle, muscle-shell combined and shell semicarbazide (SEM) are presented in Table 2. Semicarbazide was found in all samples investigated at different degrees. The study found significant (ANOVA, P < 0.05) spatial variation among the samples (Table 2). The mean concentration of SEM was highest for muscle (0.33±0.01 ng/g), shell-muscle combined 3.13±0.11 ng/g, and shell 3.51±0.03 ng/g respectively in commercial farming areas (FR) (Figure 2). On the other hand, SEM levels were in the lowest concentration in muscle (0.29±0.01 ng/g), shell-muscle combined 1.55±0.33 ng/g and shell 3.21±0.05 ng/g respectively from breeding ground areas (BR) (Figure 3). Moreover, the SEM concentration showed a significant difference (ANOVA, P < 0.01) among tissue samples (Figure 2), and the highest was recorded in shell (3.45±0.03 ng/g) compared to muscle tissue (0.33±0.01 ng/g) respectively (Table 2). The reference point for action level was within the limit (≤ 0.50 ng/g) for muscle and over the limit (> 0.50 ng/g) for shell and shell-muscle combined samples (Figure 3).

Note: BG=Breeding ground, FR=Commercial farming, RV=River, RPA =Reference point for action.

3.3 Spatial Occurrence of SEM in Water and Soil Sediments

The spatial distribution of standard error of the mean (SEM) is delineated in Table 3. The SEM values demonstrated a degree of uniformity between between bottom soils in breeding grounds and commercial farms. However, a pronounced disparity was observed in river bottom soil, where SEM values surpassed those of the former environments. Conversely, water SEM levels exhibited significant heterogeneity, as detailed in Table 3. Across all instances, SEM values remained below 0.1 ng/g.

Note: Values in each row with different superscripts are significantly different (P < 0.05 (BG=Breeding ground, FR=Commercial farming and RV=River).

3.4 Quantification of SEM in Snail and Tilapia Fed to Commercial Mud Crab Farms

The study investigated the effect of other feeds on SEM concentration in soft-shell crab muscle, shell-muscle combined, and shell. Commercial feed showed no significant variation (ANOVA, P > 0.05) between snail and tilapia feed (Table 4).

The SEM concentration for muscle ranges (0.31-.37 ng/g), shell-muscle combined 2.15-3.54 ng/g and shell 3.31-3.67 ng/g respectively. In the case of tilapia feed, the SEM concentration for muscle ranges (0.31-.37 ng/g), shell-muscle combined 3.16-3.54 ng/g and shell 33.51-3.65 ng/g respectively (Figure 4).

4. DISCUSSION

The commercial raising of mud crabs is a substantial industry throughout Southeast Asia (Pavasovic et al., 2004). however the mud crabs are associated with the presence of Semicarbazide (SEM) contaminat. The health and survival of marine creatures are at risk due to the SEM, a common contaminant in marine ecosystems that can result in cancer and cell mutation (Zhou et al., 2022). SEM has emerged as an significant environmental and food contaminant because of its bio-toxicity and transmission through the food chain. SEM generated in aquatic environment in a variety of ways forming a new contaminant for marine ecosystem that can be accumulated in the water, soil sediments and muscle tissue of crustaceans that is the concern for human health because it has chances of bioaccumulation (Tian et al., 2017). As a result, SEM contamination in seafood-producing regions could pose a significant risk to human health (Tian et al., 2017). The present study findings revealed the spatial variation of the SEM occurrence and concentration at different levels in water, soil sediments and mud crab tissues. Analysis of water quality data provides insight into the ideal natural environment for mud crabs (S. olivacea). According to a review optimal water conditions for growth and acclimatization include a temperature range of 27–30 °C and salinity of 15-34 ppt by (Pati et al., 2023). Additionally, a pH of 7.8–8.2 is considered ideal for normal growth and physiological functions of mud crabs. SEM can be occurred in crustaceans naturally through its normal physiological conditions (Rairat et al., 2024). This is likely due to SEM absorption in marine environments (Tian et al., 2017). The crab muscle was recorded with the lowest and highest concentrations in the shell. Previous studies on the SEM concentration of crabs also recorded higher concentration in the shell than in the muscle (Table 5), which signifies that SEM originates in the shell and is then distributed to the muscle (McCracken et al., 2013; Rairat et al., 2024).

The measured SEM concentrations aligned with those reported for wild crabs (Table 5). The concentration of SEM in mussels, shrimps, and sea cucumbers was detected as low level such as 0.5 μg/kg to 1.0 μg/kg without utilizing NFZ reported by the institute in Shandong Province (Tian et al., 2017). Furthermore, it was reported that the tissue-bound SEM in mud crab muscle ranged 0-0.40 ng/g, and 1.65-22.75 ng/g in mud crab shell that was similar to the present study (Rairat et al., 2024). Besides SEM was not detected in blue swimming crab muscle but present at the shell ranged 0-2.92 ng/g however the tissue-bound SEM was detected in 33% of the muscle samples of the giant river prawn (McCracken et al., 2013). It is reported that SEM is commonly found in wild crustaceans that have never been exposed to NFZ meaning it occurs spontaneously however, the biosynthetic mechanisms and physiological actions in crustaceans are still unknown (Rairat et al., 2024). The analysis reported that SEM can be biosynthesized through a variety of processes from precursors including as urea, arginine, lysine, histidine, glutamine, citrulline, and hydrazine (Zhang et al., 2016). Furthermore, whether the SEM is created by the animal or symbiotic microbes, and how the SEM biosynthesis is related to the molting cycle, age, body size, nutritional state, and other physiological parameters, remain unresolved and warrant further investigation (Rairat et al., 2024).

On the other hand, analysis of crab feed revealed no significant discrepancies between snail-based and tilapia-based feeds (Table 4). This finding suggests that dietary sources were unlikely to be responsible for the elevated SEM. Moreover, SEM concentrations in the culture farm’s water and bottom sediment were lower compared to the natural habitat (Table 3). The overall higher SEM levels in the crabs from the commercial farm compared to the wild population suggest that a combination of cultural practices and the crabs’ physiological responses within that environment may have contributed to the observed accumulation.

Interestingly, spatial variations in water and bottom sediment SEM were observed, albeit at very low levels (<0.1 ng/g). The study demonstrated a temperature-dependent uptake and elimination of drugs in crab hemolymph at 26 °C, suggesting a potential link between lower habitat temperatures and SEM accumulation (Fang et al., 2008). Consequently, deviations from the optimal habitat temperature could potentially influence SEM deposition. Given the known biosynthesis of SEM from metabolic byproducts and fertilizers the observed low concentrations likely represent physiological processes rather than environmental contamination (Rairat et al., 2024; Ec Commission Regulation (EU), 2019/1871). However, additional expansion is necessary for this research because there are few sampling sites, geological data, in-depth investigations on other farming practices, and sufficient literature data on that species. The study can serve as a springboard for further research into SEM occurrences devoid of NFZ-implemented products.

The natural occurrence of SEM at different tissue levels, which is very high from the RPA level, is proven. As a result, this crustacean requires immediate attention to the RPA level of SEM. Thorough research into the SEM biosynthesis pathway is necessary to determine the valid reasons behind this phenomenon. In addition, the use of SEM alone to detect NFZ abuse raises doubts; alternate methods or the inclusion of other chemical remnants of nitrofuran abuse, such as metabolites like AOZ, AMOZ, and AHD, need to be considered (Rairat et al., 2024; Ec Commission Regulation (EU), 2019/1871).

5. CONCLUSION

Mud crab (S. olivacea) tissues and their surrounding environment exhibited spatial variability in SEM concentration. Shells contained significantly higher SEM levels compared to muscle tissue. Interestingly, commercially farmed crabs displayed the highest tissue concentrations of SEM, even though the water and bottom sediment surrounding these crabs had the lowest SEM concentrations of all sampling locations. This suggests that factors specific to commercial aquaculture practices, rather than dietary sources, may be driving the observed SEM accumulation in these crabs. Further research is needed to investigate these potential contributing factors, which could include elements of water management, pond substrate composition, or interactions with the crabs’ natural physiology during the molting process. Additionally, the role of SEM in crustacean molting chemistry warrants further exploration. The current SEM guidelines should be reevaluated, as SEM occurs naturally exceed established thresholds, questioning SEM as a sole marker for nitrofuran abuse in crustaceans. A broader approach incorporating additional markers and a more in-depth analysis of nitrofuran metabolites is likely necessary.

ACKNOWLEDGEMENT

This study was funded by United Nations Development Programme (UNDP), Bangladesh office. The authors are grateful to the management of Japan Fast Trade Ltd. (JFTL) for providing research facilities.

REFERENCES

Abernethy, G.A.,2015. Generation of semicarbazide from natural azine development in foods, followed by reaction with urea compounds. Food Additives and Contaminants: Part A. 2015;32(9):Pp. 1416–30.

Benford, D., Ceccatelli, S., Cottrill, B., DiNovi, M., Dogliotti, E., Edler, L., et al., 2015. Scientific Opinion on nitrofurans and their metabolites in food. EFSA Journal. 2015 Jun 1;13(6).

Boncompagni, E., Muhammad, A., Jabeen, R., Orvini, E., Gandini, C., Sanpera, C., Ruiz, X., Fasola, M., 2003. Egrets as monitors of trace-metal contamination in wetlands of Pakistan. Archives of Environmental Contamination and Toxicology. 2003 Oct;45: Pp. 399-406.

Commission Regulation, E.,2019. Scientific Opinion on Chloramphenicol in food and feed. EFSA Journal. 2019 Nov 1;

Cooper, K. M., Mulder, P. J., Van Rhijn, J. A., Kovacsics, L., McCracken, R. J., Young, P. B., and Kennedy, D. G., 2005. Depletion of four nitrofuran antibiotics and their tissue-bound metabolites in porcine tissues and determination using LC-MS/MS and HPLC-UV. Food Addit Contam [Internet]. 2005;22(5): Pp. 406–14. Available from: https:// doi.org/ 10.1080/ 02652030512331385218.

EC. Commission Regulation (EU), 2019/1871 of November 7 2019 on reference points for action for non-allowed pharmacologically active substances present in food of animal origin and repealing Decision 2005/34/EC, 32019R1871. Vol. 289. Off. J. Eur. Union L; 2019.

Fang, W.H., Hu, L.L., Yang, X.L., Hu, K., Liang, S.C., Zhou, S.,2008. Effect of temperature on pharmacokinetics of enrofloxacin in mud crab, Scylla serrata (Forsskål), following oral administration. J Fish Dis. 2008;31(3): Pp. 171–6.

Hannan, M.A., Munir, M.B., Asdari, R., Islam, M.S., Lima, R.A., Islam, H.R., Rashid, M.H., Hing, H.W., 2024. Dietary lacto-sacc stimulates the immune response of gravid mud crab (Scylla olivacea). Comparative Immunology Reports. 2024 Dec 1;7:200156.

Hannan, M.A., Pandit, C., Hasan, M.J., Mahdi, G.M., Asdari, R., Munir, M.B., 2024. Quantification of heavy metals in wild gravid female mud crab (Scylla olivacea) collected from different rivers of Sundarbans mangrove region. Desalination and Water Treatment. 2024 Jul 1;319:100521.

Hui-Juan, Y., Bing, L., You-Qiong, C., Fang-Ting, Y., Jian-Ming, T., Yun-Hua, H., et al., 2012. Determination of semicarbazide content in crustaceans by liquid chromatography tandem mass spectrometry. Chinese Journal Of Analytical Chemistry. 2012;

Huizhen W, Zhi L, Hu Z, Shuangnan X, Chao T, Wei L, et al. Identification of endogenous and exogenous semicarbazide (SEM) in crustacea aquatic products using compound-specific nitrogen stable isotope ratio analysis (NSIRA). Journal of Food Composition and Analysis. 2023 Jun 1;119:105257.

Li, M., Sun, Y., Ma, C., Hua, Y., Zhang, L., Shen, J., 2021. Design and Investigation of Penetrating Mechanism of Octaarginine-Modified Alginate Nanoparticles for Improving Intestinal Insulin Delivery. J Pharm Sci. 2021 Jan 1;110(1): Pp. 268–79.

McCracken, R., Hanna, B., Ennis, D., Cantley, L., Faulkner, D., Kennedy, D.G., 2013. The occurrence of semicarbazide in the meat and shell of Bangladeshi fresh-water shrimp. Food Chem. 2013 Feb 1;136(3–4):1562–7.

McCracken, R., Hanna, B., Ennis, D., Cantley, L., Faulkner, D., Kennedy, D.G., 2013. The occurrence of semicarbazide in the meat and shell of Bangladeshi fresh-water shrimp. Food Chem [Internet]. 2013;136(3–4):1562–7. Available from: https://www.sciencedirect.com/ science/ article/ pii/S0308814611016712

McCracken, R., Hanna, B., Ennis, D., Cantley, L., Faulkner, D., Kennedy, D.G., The occurrence of semicarbazide in the meat and shell of Bangladeshi fresh-water shrimp. Food chemistry. 2013 Feb 1;136(3-4): Pp.1562-7.

Pati, S.G., Paital, B., Panda, F., Jena, S., Sahoo, D.K.,2023. Impacts of Habitat Quality on the Physiology, Ecology, and Economical Value of Mud Crab Scylla sp.: A Comprehensive Review. Water (Basel). 2023;15(11):2029.

Pavasovic, M., Richardson, N.A., Anderson, A.J., Mann, D., Mather, P.B., 2004. Effect of pH, temperature and diet on digestive enzyme profiles in the mud crab, Scylla serrata. Aquaculture. 2004 Dec 20;242(1-4): Pp. 641-54.

Pipoyan, D., Beglaryan, M., Chirkova, V., Mantovani, A., 2023.Exposure Assessment of Nitrofuran Metabolites in Fish and Honey Produced in Armenia: A Pilot Investigation. Foods. 2023 Sep 1;12(18).

Points, J., Burns, D.T., Walker, M.J., 2015. Forensic issues in the analysis of trace nitrofuran veterinary residues in food of animal origin. Food Control. 2015 Apr 1;50:92-103.

Rairat, T., Keetanon, A., Phansawat, P., Chongprachavat, N., Pichitkul, P., Kitsanayanyong, L., Kachapol, P., Suanploy, W., Chuchird, N., 2024. The presence of semicarbazide in crustaceans collected from natural habitats in Thailand. Chemosphere. 2024 Jan 1;347:140686.

Rairat, T., Keetanon, A., Phansawat, P., Chongprachavat, N., Pichitkul, P., Kitsanayanyong, L, et al., 2024. The presence of semicarbazide in crustaceans collected from natural habitats in Thailand. Chemosphere [Internet]. 2024;347:140686. Available from: https:// www. sciencedirect. com/ science /article/pii/S0045653523029569.

Saari, L,. Peltonen, K.,2004. Novel source of semicarbazide: Levels of semicarbazide in cooked crayfish samples determined by LC/MS/MS. Food Addit Contam. 2004 Sep;21(9): Pp. 825–32.
Santos-Fernández E, Govindaraju K, Jones G. , 2015. Variables sampling plans using composite samples for food quality assurance. Food Control. 2015 Apr 1;50: Pp. 530–8.

Soegianto, A., Wahyuni, H.I., Yulianto, B., Abd Manaf, L., 2022.Health risk assessment of metals in mud crab (Scylla serrata) from the East Java Estuaries of Indonesia. Environmental Toxicology and Pharmacology. 2022 Feb 1;90:103810.

Stadler, R.H., Mottier, P., Guy, P., Gremaud, E., Varga, N., Lalljie, S., et al., 2004. Semicarbazide is a minor thermal decomposition product of azodicarbonamide used in the gaskets of certain food jars. Analyst [Internet]. 2004;129(3):276–81. Available from: http://dx.doi.org/10. 1039/B314206J

Tian, X., Xu, Y., Gong, X., Han, D., Wang, Z., Zhou, Q., Sun, C., Ren, C., Xue, J., Xia, C., 2017. Environmental status and early warning value of the pollutant Semicarbazide in Jincheng and Sishili Bays, Shandong Peninsula, China. Science of the Total Environment. 2017 Jan 15;576:868-78.

Valera-Tarifa, N.M., Plaza-Bolaños, P., Romero-González, R., Martínez-Vidal, J.L., Garrido-Frenich, A., 2013.Determination of nitrofuran metabolites in seafood by ultra high performance liquid chromatography coupled to triple quadrupole tandem mass spectrometry. Journal of Food Composition and Analysis. 2013 Jun 1;30(2):Pp. 86–93.

Van Poucke, C., Detavernier, C., Wille, M., Kwakman, J., Sorgeloos, P., Van Peteghem, C., 2011. Investigation into the possible natural occurence of semicarbazide in Macrobrachium rosenbergii prawns. J Agric Food Chem. 2011 Mar 9;59(5): Pp. 2107–12.

Zhang, W., Oda, T., Yu, Q., Jin, J.O., 2015. Fucoidan from Macrocystis pyrifera has powerful immune-modulatory effects compared to three other fucoidans. Mar Drugs. 2015 Mar 1;13(3): Pp. 1084–104.

Zhang, X., Chen, S., Xu, H., Zhang, S., Yan, Z., Wang, J., 2016. Identification and occurrence of endogenous semicarbazide in prawns and crabs from Zhejiang Province, China. Food Additives and Contaminants: Part A. 2016 Feb 1;33(2):252-8.

Zhang, Y., Chen, X., Yu, H., Zhang, X., Hu, S., Chen, X., 2023. Investigation of the conversion mechanism of endogenous semicarbazide in shrimp on the amino acid level. Ecotoxicology and Environmental Safety. 2023 Jan 1;249:114393.

Zhou, X., Xiao, C., Zhu, F., 2022. The mechanism of semicarbazide (SEM) exposure causes immunosuppression and reduces disease resistance of marine crustacean species, Scylla paramamosain. Aquaculture. 2022 Sep 15;558:738404.

Zuma, N.H., Aucamp, J., N’Da, D.D., 2019. An update on derivatisation and repurposing of clinical nitrofuran drugs. European Journal of Pharmaceutical Sciences. 2019 Dec 1;140:105092.

Pages 487-494
Year 2024
Issue 4
Volume 8

Download

Water Conservation and Management (WCM)

wcm.01.2025.07.17

RESEARCH ON THE PROCESS OF DETOXIFYING AND PURIFYING HARMFUL COMPOUNDS IN GROUNDWATER USING A PILOT AUTONOMOUS UNIT

Journal: Water Conservation and Management (WCM)
Author: Askar Abdykadyrov, Palvan Kalandarov, Sunggat Marxuly, Anar Khabay, Gulzhaina Tolen, Gulnar Sharipova, Aidana Bazarbay and Perizat Akylzhan
Print ISSN : 2523-5664
Online ISSN : 2523-5672

This is an open access article distributed under the Creative Commons Attribution License CC BY 4.0, which permits unrestricted use, distribution, and reproduction in any medium, provided the original work is properly cited

Doi: 10.26480/wcm.01.2025.07.17

Abstract

This scientific work is focused on detoxifying and purifying harmful compounds in the groundwater of the Talgar district, Almaty region, using a pilot autonomous complex unit. The groundwater in the district contains heavy metals, chemical compounds, and microorganisms that pose a threat to human health and the environment. During the research, comprehensive purification methods for water detoxification and purification were considered. A pilot ETRO-02 ozonator unit, based on a special electrical corona discharge, was developed for the purification system. Filtration methods and UV radiation were also applied. The research results aim to improve the quality of groundwater and make it suitable for use in autonomous drinking water systems. During the experimental work, the efficiency of the water purification unit, its parameters, and their impact on water quality were determined. This research is an important step towards providing clean and safe drinking water in rural and urban areas. Comprehensive studies were conducted to determine the effects of ozone dose, contact time of the treated water with the ozone-air mixture, water temperature, concentration of pollutants, filtration rate, iron, manganese, and the degree of water disinfection according to the sanitary rules and regulations (2.1.4.1074-01). The ozone dose ranged between 1.5 mg/l, the contact time with the ozone-air mixture between 5 to 20 minutes, the water temperature between 9 to 15ºC, and the filtration rate between 8 to 15 m/hour. As a result, the concentration of iron significantly decreased with increasing oxidation time, from an initial value of approximately 1.4 mg/l to about 0.1 mg/l within 20 minutes. The concentration of manganese also decreased, albeit at a slower rate, from an initial value of 0.2 mg/l to about 0.03 mg/l within 20 minutes. This demonstrated that heavy metals could be effectively removed from water over a prolonged period using ozone. Additionally, the initial water contained 17 general microbial count and a coliform index of 1575, which were completely eliminated after passing through the purification unit, meeting the sanitary standards (SanPiN 2.1.4.1074-01). Moreover, data from the experiments were processed using SMath Solver and Python, and an algorithmic code was written.

Keywords

Groundwater, harmful compounds, pilot autonomous unit, detoxification, purification process, drinking water systems, environmental safety, water resources management

1. INTRODUCTION

Groundwater is an important natural resource used as drinking water in many rural and urban areas (Carrard et al., 2019; Khatri and Tyagi, 2015; Chaudhuri, and Roy, 2016). However, groundwater often contains various harmful contaminants (Sinha Ray and Elango, 2019; Ezugwu, 2015). That can be detrimental to human health and ecosystems. These contaminants include heavy metals, chemical compounds, and microorganisms (Priya et al., 2022). To address this issue, it is crucial to research and develop effective and safe methods for groundwater purification.

The aim of this study is to investigate the process of detoxifying and purifying harmful compounds in groundwater using a pilot autonomous unit. Autonomous units can be widely used in rural and remote areas because they are not dependent on electrical power and can operate independently (Peter-Varbanets et al., 2009).

The study will examine the efficiency of the unit, the detoxification methods, the parameters of the purification process, and their impact on groundwater quality. Additionally, the research results will allow for the assessment of the capabilities of autonomous units and their application in real-world conditions.

This research is an important step towards protecting the health and improving the quality of life of local residents by providing them with clean and safe drinking water.

1.1 Research Object

The object of this research is the groundwater from exploration and operational wells located in the northeast outskirts of Talgar city, Almaty region. These waters require pre-treatment to meet the requirements of sanitary rules and regulations 2.1.4.1074-01. In the laboratory setup, the optimal parameters for the technological processes (iron removal, manganese removal, and water detoxification) were determined experimentally. These parameters include ozone dose, contact time with the ozone-air mixture, filtration rate, and residual ozone concentration. These parameters ensure the quality of groundwater necessary for use in autonomous drinking water systems according to the “oxidation-filtration” scheme. A groundwater treatment technology and a technological unit with a capacity of 5 m³/hour were developed for this purpose. This unit is designed to create an autonomous drinking water system.

The research also highlights the potential for creating autonomous drinking water systems for socially significant institutions (kindergartens, schools, hospitals, etc.) based on groundwater sources. Compared to surface water, groundwater is much less susceptible to technogenic pollution and seasonal changes in chemical and bacteriological composition. However, groundwater sources intended for drinking water must meet the quality requirements of sanitary rules and regulations 2.1.4.1074-01. For instance, analysis of the groundwater layer from wells in rural areas showed high levels of iron, manganese, and coliform bacteria. Thus, there is a need for additional purification and detoxification of groundwater to ensure its quality. The technology developed is based on the “oxidation-filtration” combined method using ozone as an oxidizing agent, which is not only a strong oxidizer but also possesses high bactericidal properties.

2. MATERIALS AND METHODS

When selecting a method for groundwater purification, several factors need to be considered the initial quality of the water, the types of contaminants, the purification goals, and the economic and technical feasibility (Schwartz and Zhang, 2024; Sundaram et al., 2009). Taking into account the advantages and disadvantages of each method, general recommendations are provided (Table 1):

Based on the features and disadvantages of the methods presented in Table 1, it is possible to choose an effective method for groundwater purification.

When selecting a method for groundwater purification, several factors need to be considered: the initial quality of the water, the types of contaminants, the purification goals, economic feasibility, and technical capabilities. Taking into account the advantages and disadvantages of each method, general recommendations are as follows:

• Mechanical Filtration: This method is suitable for initial purification because it removes solid particles from the water. However, it is insufficient on its own, so it is best used in combination with other methods;
• Chemical Treatment: This method is highly effective if the water contains a large amount of chemical compounds or bacteria. However, the cost of chemical reagents and their impact on the taste and odor of the water should be considered;
• Ozone Oxidation: Widely used due to its strong oxidizing properties and high bactericidal effectiveness. Ozone can disinfect water and remove many contaminants. This method is particularly effective when protection against bacteria and viruses is needed. However, the cost of the equipment and the complexity of ozone generators should be considered;
• Ultraviolet Disinfection: Effective and environmentally friendly if the main concern is protection against bacteria and viruses. This method does not require chemical reagents, but the water must be highly transparent;
• Activated Carbon Filtration: Effective for removing organic compounds, chlorine, and odors. It is best used in combination with other methods, as it cannot remove bacteria and some chemical substances;
• Ion Exchange: Effective for removing hardness and metal ions (e.g., iron and manganese) from water. However, this method is costly and requires additional reagents.

Taking into account the advantages and disadvantages of these methods, we chose to combine them. Therefore, in the future, a comprehensive approach is recommended (Figure 1).

This combination comprehensively improves water quality and ensures a level of purification that meets the necessary requirements.

2.1 Research Objects and Methods

The scientific research work presents the results of studying and developing technological processes for the additional purification and disinfection of groundwater to create an autonomous drinking water supply system for a small rural area with 2,000 residents located near the city of Talgar. Significant reserves of groundwater have been identified in this rural area. The groundwater is of a groundwater nature, with a depth of 80 meters, and the discharge rate during test pumping of one well is 100 liters per second. The groundwater class is calcium bicarbonate, with a mineralization of 265 – 280 mg/l, neutral pH (6.5 – 7.3), and medium hardness (3.55 – 4.07 mg-eq/l). The chemical and bacteriological parameters were determined in accredited laboratories for consumer rights protection and human well-being supervision in the Almaty region. The obtained results showed that these waters could not be used in household drinking water systems without preliminary purification and disinfection, as they contain high levels of iron, manganese ions, and coliform bacteria (Table 2).

To develop the technology for the additional purification and disinfection of well water, a two-stage water treatment scheme, “oxidation-filtration,” using ozone as an oxidizer was adopted (Figure 2).

For conducting these laboratory experiments, the ETRO-02 pilot ozonator unit based on electric corona discharge was used (Abdykadyrov et al., 2021; Abdykadyrov et al., 2020). Ozone concentration was introduced in the range of 0.1 − 1.0 mg/min. The ozonizing contact chamber was a quartz glass column with a diameter of 30 mm and a height of 1500 mm. The filter was made of a glass tube with a diameter of 30 mm and a height of 1000 mm. As filtering materials, quartz sand (0.8 – 2.0 mm), activated carbon (1 – 3 mm), powdered anthracite (0.8 – 2.0 mm), as well as a two-layer load consisting of quartz sand and activated carbon were used. In the contact chamber, water supplied by a peristaltic pump was treated with an ozone-air mixture from the ozone generator, resulting in the processes of water disinfection and oxidation of iron and manganese, forming poorly soluble compounds Fe(OH)3 and MnO2. During this process, the color index of the ozonated water increases. The resulting heterogeneous system is directed to filters with the appropriate filtering load. In the filters, the heterogeneous system is separated, resulting in a decrease in the concentrations of iron and manganese due to the adsorption of their poorly soluble compounds, and the ozonated water becomes clearer. This setup allows for the adjustment of ozone dose, the residence time of the treated water in the contact chamber, water temperature, and the filtration rate through the filtering load (Draginsky, 2007). The use of multiple filters in the setup ensures the selection of the nature of the filtering material. The flow rate of the ozone-air mixture was monitored using a gas meter, and the ozone concentration in the ozone-air mixture and the residual ozone concentration were determined by the iodometric method. The required ozone dose for water disinfection and oxidation of contaminants was calculated using the following formula (D).

D=(A∙t)/V,mg/l (1)

Here, (A) is the productivity of the ozone generator (mg/min); (t) is the ozonation time (min); (V) is the volume of the treated water (l). The amounts of iron and manganese ions in the studied water, as well as the water’s color, were determined by the photo-colorimetric method (Fernandes et al., 2020). The bacteriological parameters of the studied water samples were determined in the accredited laboratory of GKP “Astana Su Arnasy”.

In such a scheme, the first stage involves the oxidation and coagulation of contaminants, while the second stage involves the separation of the resulting heterogeneous system and the disinfection of the water (Fernandes et al., 2020; Adarsh et al., 2013). The advantages of ozone compared to other oxidizers are shown in Figure 3 (Draginsky, 2007; Abdykadyrov et al., 2024).

During the process, the use of ozone as an oxidizer has shown that it significantly simplifies the technological scheme of water purification. It promotes deep disinfection and the removal of iron and manganese without deteriorating the taste properties of the water (Abdykadyrov et al., 2023; Ngwenya et al., 2012; Kalandarov, 2024). Such technological units increase the efficiency of preparing both surface and groundwater for drinking purposes. However, implementing such water purification schemes requires precise tuning of the technological process, particularly the optimal conditions for ozonation. This includes determining the necessary amount of ozone for oxidizing organic and mineral contaminants and disinfecting the water, the contact time between the ozone-air mixture and the treated water, and the impact of the chemical nature and concentration of contaminants on the purification degree. In some cases, exceeding the ozone dose can lead to the formation of toxic reaction products in the treated water (Draginsky, 2007). The optimization of the technological process parameters for additional purification and disinfection of water from the exploration and operational well was carried out in an extended laboratory setup. This setup consisted of a reservoir, a peristaltic pump, an ozone generator, a contact chamber, an absorber, a gas meter, a thermostat, a distribution device, and a filter (Figure 2).

2.2 Theory Of Ozone Treatment Of Groundwater

Mathematical models and equations describing the process of ozone treatment of groundwater include the interaction of ozone with contaminants in the water, the decomposition of ozone, and the contact time (Draginsky, 2007; Derco et al., 2021). The main mathematical equations governing the process are as follows:

1. Ozone Generation: The production of ozone in an ozone generator is primarily described by the following equation (Jodzis and Baran, 2022):
О_2 (Electrical discharges) ⃗ О_3 (2)
2. Ozone Decomposition Kinetics: The kinetics of ozone decomposition in water is described by the following differential equation ( Lovato et al., 2009):
d[O_3 ]/dt=-k_d [O_3 ] (3)
where [O3] is the ozone concentration at time (t), and (kd) is the decomposition constant of ozone.
3. Reaction of Ozone with Contaminants: The reaction of ozone with contaminants in water can be described by the following equation (Von Sonntag and Von Gunten, 2012):
O_3+R →P (4)
where (R) is the contaminant, and (P) are the reaction products.
The kinetics of this reaction (Draginsky, 2007; Von Sonntag and Von Gunten, 2012):
d[R]/dt=-k_r [O_3 ] [R] (5)
where (kr) is the reaction rate constant.
4. Time-Dependence of Ozone Concentration: The time – dependence of ozone concentration can be described as follows (Von Sonntag, and Von Gunten, 2012):
[О_3 ](t)=[O_3 ]_o e^(-k_d t) (6)
where [O3]o is the initial ozone concentration.
5. Time-Dependence of Contaminant Concentration: The time – dependence of the contaminant concentration can be described by the following expression:
[R](t)=[R]_o e^(-k_r [O_3 ]_o t) (7)
where [R]o is the initial concentration of the contaminant.
6. Overall Ozone Balance Equation: The equation describing the overall ozone balance is as follows:
d[O_3 ]/dt=-k_d [O_3 ]-k_r [O_3 ][R] (8)
Reaction Time Calculation: The time for the complete reaction of ozone with a specific contaminant in water is determined by the following equation (Draginsky, 2007):
t=1/(k_r [O_3 ]_o )ln(([R]_o)/[R](t) ) (9)
These equations (2,3,4…9) describe the generation of ozone, its decomposition in water, and its reactions with contaminants. By using these equations, the ozone treatment process can be mathematically modeled and effectively managed. Based on this theoretical foundation, we have decided to conduct experimental work for scientific research in collaboration with the Kazakh National Research Technical University named after K.I. Satbayev (Republic of Kazakhstan) and the “Tashkent Institute of Irrigation and Agricultural Mechanization Engineers” National Research University (Republic of Uzbekistan).

3. RESULTS AND DISCUSSIONS

Groundwater pollution and its purification are among the most pressing contemporary issues. Considering these issues, a joint scientific research project was conducted by the Kazakh National Research Technical University named after K.I. Satbayev (Republic of Kazakhstan) and the “Tashkent Institute of Irrigation and Agricultural Mechanization Engineers” National Research University (Republic of Uzbekistan). This research aimed to determine how to effectively detoxify harmful compounds in groundwater using a pilot autonomous unit. The pilot unit employs various methods, including mechanical filtration, ozone oxidation, ultraviolet disinfection, and activated carbon filtration.

3.1 Research Results

Comprehensive studies were conducted in the laboratory setup to determine the effects of ozone dose, contact time of the treated water with the ozone-air mixture, water temperature, contaminant concentrations, filtration rate, iron, manganese, and the degree of water disinfection in accordance with the sanitary rules and regulations 2.1.4.1074-01. The ozone dose was varied between 1.5 ÷ 3.5 mg/l, the contact time with the ozone-air mixture between 5 ÷ 20 minutes, the water temperature between 9 ÷ 15ºC, the filtration rate between 8 ÷ 15 m/hour, iron concentration between 0.75 ÷ 1.25 mg/l, and manganese concentration between 0.10 ÷ 0.25 mg/l. As a result of the studies, the optimal parameters for the processes of iron and manganese removal, precipitation, and disinfection of groundwater were determined: ozone dose of 1.5 mg/l, contact time with the ozone-air mixture of 20 minutes, filtration rate of 15 m/hour, and residual ozone concentration of 0.1 ÷ 0.3 mg/l. The quality indicators of the water treated in the laboratory setup (Table 3) demonstrate that it can be used in an autonomous drinking water supply system. The levels of iron, manganese, and coliform index comply with the requirements of the sanitary rules and regulations 2.1.4.1074-01.

Based on the research work, the purification of water from the well to remove heavy metals and disinfect harmful bacteria was carried out using the ETRO-02 ozonator unit based on pilot electric corona discharge (Abdykadyrov, 2014). The main technological scheme of water purification includes the following stages (Figure 4).

In the first stage, the initial water is saturated with the ozone-air mixture, and then the oxidation and disinfection process occurs in the contact apparatus. In the second stage, suspended particles are removed by filtering the water through quartz sand, and the adsorption of organic contaminants on the surface of activated carbon takes place. In the third stage, the purified and disinfected water undergoes additional treatment with ultraviolet rays before being supplied to the consumer. A filter cleaning stage is also included, and the resulting dirty water is discharged into the sewer. This scheme allows for the purification and disinfection of water containing excess iron, manganese, and organic substances. The main diagram of the technological unit for purifying groundwater with a capacity of 5 m³/h is shown in Figure 5.

The initial water from the well is supplied to the contact chamber via a centrifugal pump, an ozone-air mixture (ETRO-02 ozone generator), and an ejector, where the oxidation of iron, manganese, and organic substances present in the water and its disinfection occur. Unreacted ozone is directed to the degasser and eliminated. The unit includes a control unit that allows the production of different amounts of ozone. To increase the mixing coefficient of water and the ozone-air mixture, the technological scheme employs an ejector mixing system. Due to its kinetic energy, water in the ejector captures the mass of the ozone-air mixture and converts it into a water-air emulsion. The use of the ejector allows significantly reducing the volume of the contact chamber and achieving an ozone absorption coefficient of up to 90%, with the height of the contact chamber not exceeding 2.0 m. From the contact chamber, the ozonated water is fed into the first chamber of the pressure filter filled with quartz sand, where large dispersed contaminants are removed. In the second contact chamber filled with activated carbon, the adsorption of unoxidized organic substances occurs. After passing through the activated carbon layer, the water undergoes bactericidal treatment to prevent secondary bacterial contamination. Then, the purified and disinfected water is directed to the storage reservoir, from which it is supplied to the consumer by a centrifugal pump.

Comprehensive studies conducted on an enlarged laboratory setup for preparing groundwater from wells allow the creation of an autonomous drinking water system. This made it possible to determine the main technological parameters for the processes of iron removal, demanganization, clarification, and disinfection. The conducted scientific research enabled the development of a technological unit with a capacity of 5 m³/h for water treatment technology.
When choosing the unit, it was considered that, with the iron content in the water varying up to 1.25 mg/l and the manganese content up to 0.25 mg/l, the technological process could be purposefully adjusted and the energy costs for ozone production could be reduced without reducing the efficiency of the purification and disinfection processes. A technical specification for the design of an industrial unit was developed, and its implementation will address the socially important issue of creating autonomous drinking water supply systems.

Below is a brief explanation of each step:

  • Air Ozonator (ETRO-02): This device converts oxygen in the air into ozone;
  • Ejector: Introduces ozone into the water flow to create an ozonated water solution;
  • Contact Chamber (Reservoir): Ozone is introduced into the water in this chamber for disinfection;
  • Degasser: Removes excess gases by separating ozone from the water;
  • Pressure Filter: Uses a pressure filter to filter the water;
  • Bactericidal Lamp: Uses ultraviolet radiation to eliminate bacteria;
  • Water Storage Tank: Stores the purified water before it is delivered to the consumer.This technological scheme involves several integrated purification and disinfection stages to ensure efficient water purification and safe drinking water provision.

    3.2 Mathematical Modeling of Research Results

    In the scientific research work, mathematical modeling was conducted in two scenarios to improve the efficiency of the technological process:

    Option 1: Oxidation Process of Excess Heavy Metals.
    The oxidation reactions of iron (Fe) and manganese (Mn) with ozone (O₃) found in water extracted from the well proceed as follows. Oxidation of Iron with Ozone: When iron (II) ion (Fe²⁺) reacts with ozone, iron (III) ion (Fe³⁺) is formed:

    2Fe2+ + O3 + 2H2O → 2Fe3+ + O2 + 4OH−
    Fe^(3+)+3OH^-=Fe(OH)_3↓ (10)
    Fe(OH)_2↓+O_3+H_2 O=Fe(OH)_3↓+O_2+OH^-

    Oxidation of Manganese with Ozone: When manganese (II) ion (Mn²⁺) reacts with ozone, manganese (IV) dioxide (MnO₂) is formed:

    2Mn2+ + O3 + 4H2O → 2MnO2 + O2 + 8H+
    6Mn^(2+)+O_3+12OH^-=3Mn_2 O_3 (H_2 O)↓+3H_2 O (11)
    Mn(OH)_2+O_3=MnO_2↓+O_2+H_2 O

    These reactions oxidize the iron and manganese ions in the water, converting them into insoluble compounds, thereby allowing their removal from the water (the research results are shown in Tables 4 and 5).

This graph shows the decrease in the concentration of iron (Fe²⁺) and manganese (Mn²⁺) with the increase in the amount of ozone (O₃). The concentration of iron significantly decreases as the amount of ozone increases from 0 to 1.5 mg/L, dropping from an initial value of 1.4 mg/L to approximately 0.1 mg/L. The concentration of manganese also decreases, but at a slower rate, from an initial value of 0.2 mg/L to approximately 0.03 mg/L. This indicates that ozone effectively oxidizes both iron and manganese, reducing their concentrations.

This graph shows the effect of oxidation time (minutes) on the concentration of heavy metals (iron (Fe²⁺) and manganese (Mn²⁺)). The concentration of iron significantly decreases as the oxidation time increases, dropping from an initial value of approximately 1.4 mg/L to about 0.1 mg/L within 20 minutes. The concentration of manganese also decreases, but at a slower rate, from an initial value of 0.2 mg/L to approximately 0.03 mg/L within 20 minutes. This indicates that using ozone over an extended period can effectively remove heavy metals from the water.

Based on the data obtained from this experiment, the algorithmic code for the process of oxidizing water to remove heavy metals can be written in Python. To enhance the accuracy of the numerical spectral correlation, the analytical signal can be reconstructed for processing the incomplete spectrum of the signal (Smailov et al., 2023; Sabibolda et al., 2022). The following steps can be taken to create the algorithm (Figure 8):

TThe algorithm illustrated in Figure 8 allows for the calculation of iron and manganese concentrations based on the amount of ozone. Similarly, it demonstrates the algorithm for determining the concentrations of iron (Fe²⁺) and manganese (Mn²⁺) based on the amount of ozone (O₃). The first step is data collection, where the amount of ozone and the corresponding concentrations of iron and manganese are provided. In the second step, the data is organized in the form of a table or dataset. Finally, a Python function is presented that calculates the concentrations of iron and manganese according to the input amount of ozone.

Option 2: Disinfection Process of Harmful Microorganisms in Water.

The process of disinfecting groundwater with ozone and ultraviolet (UV) radiation is complex, but we first theoretically calculated it and then computed the algorithmic steps in Python. Initially, we determine the total number of microbes and the coliform index, and then we perform calculations for the disinfection process using ozone and UV radiation. The total number of microbes refers to the overall count of microorganisms in the water. The coliform index indicates the number of coliform bacteria (e.g., Escherichia coli) in the water. The process of disinfecting the total number of microbes and the coliform index found in the water extracted from the well using ozone (O₃) and then UV radiation proceeds as follows:

Ozone Disinfection Process: The efficiency of ozone in destroying bacteria depends on its concentration and the contact time. To kill microbes, the product of ozone concentration (C) and contact time (T) must equal a specific value (CT). This value varies for different microbes. For example, in our case, the CT value for E. coli is 30 mg·min/L. If the ozone concentration in the water is 1.5 mg/L and the contact time is 20 minutes:

CT = C·T = 1,5  mg/L ·20  minutes = 30 mg·min/L   (12)

This value of 30 mg·min/L from equation (12) is sufficient for E. coli.
UV Radiation Disinfection: The effectiveness of UV radiation in killing bacteria depends on the radiation dose, measured in microjoules per square centimeter (μJ/cm²). The required dose for disinfecting water varies depending on the type of microorganism. For example, in our case, the required dose for E. coli is between 30,000 and 40,000 μJ/cm². If, for instance, the UV lamp has a power of 40 W, the water flow rate is 1 L/sec, and the exposure time is 10 seconds, the dose can be calculated as follows:

Dose=Power/(Water Flow Rate )·Exposure Time = 40W/(1 L/s)·10s= 400 W·s/L (13)
To convert the radiation dose to microjoules per square centimeter (1 W = 10^6 μJ):
400 W·s/L=400·10^6 μJ/L=400,000μJ/〖cm〗^2 (14)

This dose calculated in equations (13) and (14) is sufficient to kill E. coli.
To perform theoretical calculations for the combined disinfection process of the total number of microbes and the coliform index using ozone and ultraviolet (UV) radiation, the following algorithmic steps were executed in Python (Figure 9):

Figure 9 illustrates the flowchart of the Python program, which describes the process of calculating the number of microbes and the coliform index under the influence of ozone and ultraviolet (UV) radiation. The diagram begins with the input of initial data (e.g., the number of microbes, ozone concentration, and UV radiation intensity). Next, the logarithmic reduction effects of ozone and UV radiation are calculated separately. These two effects are then combined to determine the overall logarithmic reduction. Finally, the resulting number of microbes and the coliform index are calculated, and the results are displayed on the screen. This diagram visually represents the step-by-step algorithm of the program.

3.3 Discussion of Scientific Research Work

In the research work, it was observed that when the amount of ozone is 1.5 mg/L, the initial concentration of heavy iron ions in the water decreases from 1.25 mg/L to 0.1 mg/L, and the concentration of manganese decreases from 0.25 mg/L to 0.03 mg/L. These values fully meet the requirements specified in the sanitary rules and regulations 2.1.4.1074-01 (Figures 10 and 11).

Figure 10 shows the iron content in water, measured in milligrams per liter (mg/L), before and after treatment. The initial amount of iron in the water is approximately 1.2 mg/L. After treatment, the iron content significantly decreases to about 0.1 mg/L. This indicates that the purification process is highly effective in reducing the iron content in the water. The iron content decreases by approximately 90%, demonstrating the efficiency of the water purification process.

Figure 11 shows a bar chart comparing the manganese content (mg/L) levels in the initial water and the treated water. For example, the manganese content in the initial water is approximately 0.25 mg/L, while after treatment, the manganese content decreases to about 0.05 mg/L.

During the ozonation process, the pH property plays an important role. First, the pH level determines the solubility and stability of ozone in water, which is necessary to enhance the effect of ozone. Second, at lower pH values, the decomposition of ozone occurs more rapidly, resulting in the formation of hydroxyl radicals, which clean the water more effectively. Third, the pH level affects the efficiency of the ozonation process and the quality of the treated water. Fourth, monitoring pH levels is important to optimize the disinfecting effect of ozone and to prevent system corrosion (Figure 12).

Figure 12 shows a bar chart comparing the hydrogen index (pH) of initial water and water after purification. For example, the pH level of the initial water is approximately 8 units. After purification, the pH level of the water is approximately pH = 7.5 units. The diagram shows that the pH level of the water slightly decreases after the purification process. The initial water’s pH level is alkaline, at pH = 8, while after purification, it is slightly neutralized to pH = 7.5.

The presence of microorganisms in water, such as the coliform index and the total microbial count, poses significant health risks. These indicators show the level of bacterial contamination in the water, which can cause intestinal infections and other diseases. The coliform index is often an indicator of fecal contamination, and its high level suggests poor sanitary conditions of the water sources. A high total microbial count can be dangerous for individuals with weakened immune systems, as it indicates the abundance of pathogenic bacteria.

Ozone water purification effectively reduces the harmful coliform index and total microbial count, as ozone possesses strong disinfectant properties. It disrupts the cell walls of bacteria, halting their reproduction and completely destroying them. Additionally, ozone is an environmentally friendly method, as it leaves no chemical residues in the water and quickly breaks down into oxygen. The research results are shown in Figures 13 and 14 below.

Figure 14 shows a bar chart comparing the total microbial count of initial water and water after purification. For example, the total microbial count in the initial water is approximately 16 units. After purification, the total microbial count in the water is approximately 2 units. The diagram shows a significant reduction in microbial contamination after the purification process. This demonstrates the effectiveness of the purification method and the improvement in water quality.

However, to completely purify and disinfect the water, it was necessary to add comprehensive purification methods to the technological scheme (Figure 5). Figure 5 shows the use of UV radiation and filters made from various sorbents along with ozone. The results of the study can be observed in Table 6 below.

Table 6 compares the quality of groundwater from the initial well and water purified using comprehensive methods against sanitary rules and norm standards. The levels of iron and manganese in the initial water are high, but after purification, these levels meet the requirements of sanitary rules and norm standards. Additionally, while the coliform index and microbial count in the initial water are high, these indicators are undetectable in the purified water, indicating complete purification. Overall, the comprehensive purification methods significantly improve the water quality, making it compliant with sanitary standards.

4. CONCLUSION

This study focuses on the decontamination and purification of harmful substances in the groundwater of the Talgar district in the Almaty region using a pilot autonomous installation. The research results show that the groundwater in the area contains high levels of heavy metals (iron (Fe²⁺) and manganese (Mn²⁺)), chemical compounds, and microorganisms (coliform index and total microbial count), which are harmful to human health and the environment. To eliminate these harmful substances, comprehensive purification methods were used, including the pilot ETRO-02 ozonator installation based on electric discharge, filtration methods, and ultraviolet (UV) radiation.

In the study, the concentration of iron significantly decreases with increased oxidation time, from an initial value of approximately 1.4 mg/L to about 0.1 mg/L within 20 minutes. The concentration of manganese also decreases, albeit at a slower rate, from an initial value of 0.2 mg/L to about 0.03 mg/L within 20 minutes. This demonstrates the effectiveness of using ozone to remove heavy metals from water over a prolonged period. Similarly, the initial water had a total microbial count of 17 and a coliform index of 1575, which were completely eliminated after passing through the purification system. These values comply with sanitary rules and standards (SanPiN 2.1.4.1074-01). Additionally, the data obtained from the experiments were processed using SMath Solver and Python, with their algorithmic code written.

The quality indicators of the water processed in the laboratory installation prove that it can be used in an autonomous drinking water supply system. This research is an important step towards providing clean and safe drinking water in rural and urban areas. The results of the practical work demonstrate that comprehensive purification methods significantly improve the quality of groundwater, allowing its use in safe drinking water systems.

REFERENCES

Carrard N., Foster T., Willetts J., 2019.Groundwater as a source of drinking water in southeast Asia and the Pacific: A multi-country review of current reliance and resource concerns //Water. – 2019. – Т. 11. – №. 8. – С. 1605. https://doi.org/10.3390/w11081605

Khatri, N., Tyagi, S., 2015. Influences of natural and anthropogenic factors on surface and groundwater quality in rural and urban areas //Frontiers in life science. – 2015. – Т. 8. – №. 1. – С. 23-39. https://doi.org/10.1080/21553769.2014.933716

Chaudhuri, S., Roy, M.,2016. Reflections on groundwater quality and urban-rural disparity in drinking water sources in the state of Haryana, India //IJSRD-International Journal for Scientific Research and Development. – 2016. – Т. 4. – №. 4. – С. 837-843. https://pure.jgu.edu.in/id/eprint/2953/1/Roy2016.pdf

Sinha Ray S. P., Elango L., 2019. Deterioration of groundwater quality: Implications and management //Water governance: Challenges and prospects. – 2019. – С. 87-101. file:///C:/Users/Admin/Downloads /978-981-13-2700-1_5.pdf

Ezugwu, C. N., 2015. Ground water contamination and potential health effects //International Journal in IT and Engineering. – 2015. – Т. 3. – С. 83-93. https://d1wqtxts1xzle7.cloudfront.net/60147299/IJITE21 10Jan820190729-90729-1dpgcrzlibre.pdf?1564404167=&response-contentdisposition=inline%3B+filename%3dgroundwater_Contamination_And_Potential.pdf&Expires=1721104312&Signature=RFkHFpQ~yEvPJzZp4MTn2IQOXduvbhirMS6Dj06nSup3b0P~FcCCYz~OHwX1tXChUYKsKrgSsZCe0L5j-V~FjJXoR~bh8TYgS~wZw8pEgpvROeiqa6H BPGa6fYR2TM4Kn1mfUWXv2xFazTI4LejPjf247uJGAqDq56L5EsDBK5SwBbxNRUIV1TskhfOCtL58Nc6GzTMeiGEPg1TV7CCjgWTnyJ2jWHSSgrg7NLW3Oueo9stWR2TVnxskT28LUDCfTu43mVIKEs1exPPhNp4uc1RBjSm0N bO3sq5uPxIbWCdNYXhWpZtTIJBPVH0W1uy2VHNPE9 HgdKxS82QncxQ__&Key-Pair-Id=APKAJLOHF5GGSLRBV4ZA

Priya, A. K., Gnanasekaran, L., Dutta, K., Rajendran, S., Balakrishnan, D., and Soto-Moscoso, M., 2022. Biosorption of heavy metals by microorganisms: Evaluation of different underlying mechanisms . Chemosphere, 307, 135957.

Peter-Varbanets, M., Zurbrügg, C., Swartz, C., & Pronk, W., 2009.Decentralized systems for potable water and the potential of membrane technology //Water research. – 2009. – Т. 43. – №. 2. – С. 245-265. https://doi.org/10.1016/j.watres.2008.10.030

SANITARY AND EPIDEMIOLOGICAL RULES AND REGULATIONS SanPiN 2.1.4.1074-01 https://files.stroyinf.ru/Data1/9/9742/

Schwartz, F. W., Zhang, H., 2024. Fundamentals of groundwater. – John Wiley & Sons, 2024. scholar.google.com/scholar?hl=ru&as_sdt=0%2C5&q=There+are+several+factors+to+consider+when+choosing+a+method+for+cleaning+groundwater&btnG=#d=gs_cit&t=1721132171746&u=%2Fscholar%3Fq%3Dinfo%3Aa3rvjlGonGQJ%3Ascholar.google.com%2F%26output%3Dcite%26scirp%3D5%26hl%3Dru

Sundaram, B., Feitz, A., Caritat, P. D., Plazinska, A., Brodie, R., Coram, J., and Ransley, T., 2009. Groundwater sampling and analysis—a field guide //Geosci Aust Rec. – 2009. – Т. 27. – №. 95. – С. 104. https://gfcq.org.au/wpcontent/uploads/2022/01/GA_Record_Groundwater-Sampling-and-Analysis%E2%80%94A-Field-Guide_2009-27.pdf

Abdykadyrov, A., Marxuly, S., Baikenzheyeva, A., Bakyt, G., Abdullayev, S., and Kuttybayeva, A. E., 2023.Research of the Process of Ozonation and Sorption Filtration of Natural and Anthropogenicly Pollated Waters. Journal of Environmental Management and Tourism, [S.l.], v. 14, n. 3, p. 811 – 822, june 2023. ISSN 2068-7729. Available at: <https://journals.aserspublishing.eu/jemt/article/view/7810>. Date accessed: 28 feb. 2024. doi: https://doi.org/10.14505/jemt.v14.3(6 7).20.https://journals.aserspublishing.eu/jemt/article/view/7810

Abdykadyrov, A., Marxuly, S., Kuttybayeva, A., Almuratova, N., Yermekbayev, M., Ibekeyev, S., and Bagdollauly, Y., 2023.Study of the Process of Destruction of Harmful Microorganisms in Water. Water 2023, 15(3), 503; https://doi.org/10.3390/w15030503 https://w ww.mdpi.com/2073-4441/15/3/503

Nyer E. K., 1992. Groundwater treatment technology. – John Wiley & Sons, 1992. https://books.google.kz/books?hl=ru&lr=&id=KL0XxEwX86sC &oi=fnd&pg=PP9&dq=Methods+of+mechanical+cleaning+of+groundwater&ots=Z9ybGxuEo7&sig=LETcaxoDa6YJRMgZGRnuX69tYIs&redir_esc=y#v=onepage&q&f=false

Mohr, T., Tulloch, C., Chan, S., Cook, G., Giri, S., Broughton, P., and Crowley, J., 2007.Study of Potential for Groundwater Contamination from Past Dry Cleaner Operations in Santa Clara County. – San José, CA : Santa Clara Valley Water District, 2007. https://citeseerx.ist.psu.edu /document?repid=rep1&type=pdf&doi=f2d1f95c835d8f7f4cd8e176a493054e752280ed

Abdykadyrov A. et al., 2023.Study of The Process of Cleaning Water-Containing Iron Solutions Using Ozone Technology. Water Conservation and Management, 7(2): Pp. 148-157. http://doi.org/10. 26480/wcm.02.2023.148.157https://www.watconman.org/archives pdf/2wcm2023/2wcm2023-148-157.pdf

Abdykadyrov, A., et al., 2023. Investigation of the Efficiency of the Ozonator in the Process of Water Purification Based on the Corona Discharge. J. Ecol. Eng. 2023; 24(2):140-151 DOI: https://doi.org/10.1 2911/22998993/156610 http://www.jeeng.net/Investigation-of-the-Efficiency-of-the-Ozonator-in-the-Process-of-Water-Purification ,156610,0,2.html

Draginsky, V.L., 2007. Ozonation in water purification processes/ V.L. Draginsky, L.P.Alekseeva, V.G. Samoilovich M.: Delhi print. 2007.

Abdykadyrov A. et al., 2023. Process of Determination of Surface Water by Ultraviolet Radiations. Water Conservation and Management, 7(2): 158-167.http://doi.org/10.26480/wcm.02.2023.158.167https://ww w.watconman.org/archives-pdf/2wcm2023/2wcm2023-158-167.pdf

Afriani, L., and Trijoko, T., 2020.The ultraviolet light (UV) technology as a disinfection of drinking water (a literature study) //International Journal of Health, Education & Social (IJHES). – 2020. – Т. 3. – №. 6. – С. 1-13. DOI: https://doi.org/10.1234/ijhes.v3i6.95

Kozhaspaev N., et al., 2016. Experience in application of ozonic technology for sewage treatment in the Kumkul region of Kazakhstan. Journal of Industrial Pollution Control, 2016, 32(2), страницы Pp. 486–489 https://www.icontrolpollution.com/articles/experience-in-application-of-ozonic-technology-for-sewage-treatment-in-the-kumkul-region-of-kazakhstan.php?aid=79551

Lu, P., Yuan, T., Zhang, B., 2016. Cryptosporidium removal from runoff by active carbon filter with coal gangue //Journal of Chemistry. – 2016. – Т. 2016. – №. 1. – С. 4873427. https://doi.org/10.1155/2016/4 873427

Zhang, F., Bournival, G., Ata, S., 2024. Overview of fine coal filtration. Part II: Filtration aiding treatments and reagents //Separation and Purification Technology. – 2024. – С. 128584. https://doi.org/10 .1016/j.seppur.2024.128584

Hailu, Y., Tilahun, E., Brhane, A., Resky, H., and Sahu, O., 2019. Ion exchanges process for calcium, magnesium and total hardness from ground water with natural zeolite //Groundwater for Sustainable Development. – 2019. – Т. 8. – С. 457-467. https://doi.org/10.1016/j .gsd.2019.01.009

Apell, J. N., Boyer, T. H., 2010. Combined ion exchange treatment for removal of dissolved organic matter and hardness //Water Research. – 2010. – Т. 44. – №. 8. – С. 2419-2430. https://doi.org/10.1016/j. watres.2010.01.004

Abdykadyrov, A. A., Korovkin, N. V., Tashtai, E. T., Syrgabaev, I., Mamadiyarov, M. M., and Sunggat, M., 2021, March.Research of the process of disinfection and purification of drinking water using ETRO-02 plant based on high-frequency corona discharge. 2021 3rd International Youth Conference on Radio Electronics, Electrical and Power Engineering (REEPE). DOI: 10.1109/REEPE51337.2021.938 8046 https://ieeexplore.ieee.org/document/9388046

Abdykadyrov, A. A., Korovkin, N. V., Mamadiyarov, M. M., Tashtay, Y., and Domrachev, V. N., 2020, March. Practical Research of Efficiency of the Installation Etro-02 Ozonizer Based on the Corona Discharge. 2020 International Youth Conference on Radio Electronics, Electrical and Power Engineering (REEPE). DOI: 10.1109/REEPE49198.20 20.9059150 https://ieeexplore.ieee.org/document/9059150

Abdykadyrov, A., 2014. Device for producing ozone-air mixture “ETRO-02” Innovation patent number: No.28562 Published: 16.06.2014 https://kzpatents.com/patents/abdykadyrov-askar-ajjtmyrzaevich

Fernandes, G. M., Silva, W. R., Barreto, D. N., Lamarca, R. S., Gomes, P. C. F. L., da S Petruci, J. F., and Batista, A. D., 2020.Novel approaches for colorimetric measurements in analytical chemistry–a review //Analytica Chimica Acta. – 2020. – Т. 1135. – С. 187-203. https://doi .org/10.1016/j.aca.2020.07.030

Adarsh, N., Shanmugasundaram, M., and Ramaiah, D., 2013.Shanmugasundaram M., Ramaiah D. Efficient reaction based colorimetric probe for sensitive detection, quantification, and on-site analysis of nitrite ions in natural water resources //Analytical chemistry. – 2013. – Т. 85. – №. 21. – С. 10008-10012. https://pubs.acs .org/doi/epdf/10.1021/ac4031303

Abdykadyrov, A., Abdullayev, S., Tashtay, Y., Zhunussov, K., and Marxuly, S., 2024.Purification of surface water by using the corona discharge method //Mining of Mineral Deposits. – 2024. – Т. 18. – №. 1. https://doi.org/10.33271/mining18.01.125

Ngwenya, N., Ncube, E. J., and Parsons, J., 2012. Recent advances in drinking water disinfection: successes and challenges //Reviews of environmental contamination and toxicology. – 2012. – С. 111-170. DOIhttps://doi.org/10.1007/978-1-4614-4717-7_4

Kalandarov, P., Avezov, N., Olimov, O., Turkmenov, X., Abdykadyrov, A., 2024. Bioengineering, waste processing and fermentation process control for biogas production //BIO Web of Conferences. – EDP Sciences, 2024. – Т. 105. – С. 02005. https://doi.org/10.1051/bioconf /202410502005

Derco, J., Gotvajn, A. Ž., Čižmárová, O., Dudáš, J., Sumegová, L., and Šimovičová, K., 2021.Removal of micropollutants by ozone-based processes //Processes. – 2021. – Т. 9. – №. 6. – С. 1013. https://doi.org/10.3390/pr9061013

Jodzis, S., Baran, K., 2022. The influence of gas temperature on ozone generation and decomposition in ozone generator. How is ozone decomposed? //Vacuum. – 2022. – Т. 195. – С. 110647. https://doi.org /10.1016/j.vacuum.2021.110647

Lovato, M. E., Martín, C. A., and Cassano, A. E., 2009. A reaction kinetic model for ozone decomposition in aqueous media valid for neutral and acidic pH //Chemical Engineering Journal. – 2009. – Т. 146. – №. 3. – С. 486-497. https://doi.org/10.1016/j.cej.2008.11.001

Von Sonntag, C., Von Gunten U., 2012. Chemistry of ozone in water and wastewater treatment. – IWA publishing, 2012. file:///C:/Users /Admin/ Downloads/ external_ content% 20(4).pdf

Smailov, N., Tsyporenko, V., Sabibolda, A., Tsyporenko, V., Kabdoldina, A., Zhekambayeva, M., and Abdykadyrov, A., 2023.Improving the accuracy of a digital spectral correlation-interferometric method of direction finding with analytical signal reconstruction for processing an incomplete spectrum of the signal. Eastern-European Journal of Enterprise Technologies. 5(9 (125)):14-25 DOI: 10.15587/1729-4061.2023.288397https://papers.ssrn.com/sol3/papers.cfm?abstract_id=4069983

Sabibolda, A., Tsyporenko, V., Tsyporenko, V., Smailov, N., Zhunussov, K., Abdykadyrov, A., Duisenov, N., 2022. Improving The Accuracy And Performance Speed Of The Digital Spectral-Correlation Method For Measuring Delay In Radio Signals And Direction Finding. Eastern-European Journal of Enterprise Technologies, 1 9 (115), Pp. 6–14, 2022,doi:https://doi.org/10.15587/1729-4061.2022.252561,https:/ /papers.ssrn.com/sol3/papers.cfm?abstract_id=4069983

Pages 07-17
Year 2025
Issue 1
Volume 9

Download

Water Conservation and Management (WCM)

wcm.01.2025.01.06

ANALYSIS OF THE MAIN FACTORS INFLUENCING THE PROCESS OF DISINFECTING SURFACE WATER THROUGH ELECTRIC DISCHARGE

Journal: Water Conservation and Management (WCM)
Author: Askar Abdykadyrov, Palvan Kalandarov, Sunggat Marxuly, Anar Khabay, Gulnar Sharipova, Maral Abulkhanova and Lyazzat Zhanbayeva
Print ISSN : 2523-5664
Online ISSN : 2523-5672

This is an open access article distributed under the Creative Commons Attribution License CC BY 4.0, which permits unrestricted use, distribution, and reproduction in any medium, provided the original work is properly cited

Doi: 10.26480/wcm.01.2025.01.06

Abstract

The corona discharge significantly affects the cluster structure of water, leading to the formation of shock waves, cavitation oscillations, and minor ultraviolet radiation. Before initiating the water disinfection procedure with corona discharge, it is necessary to consider all factors influencing this process.. The article reviews the results of previous studies examining the dependence of the physico-chemical properties of water on its ionic composition and external thermodynamic or electromagnetic influences. The research was conducted using the ETRO-03 pilot laboratory setup with a specific frequency of 13 kHz and a voltage of 21 kV. The dependencies of physico-chemical characteristics such as dielectric and magnetic permeability, specific electrical conductivity, dielectric losses, and specific heat capacity of water were analyzed and described. The patterns of their changes due to external influences were determined based on initial parameters and variations in temperature (up to 40°C) and the frequency of the applied electromagnetic field. In alternating electric fields, an increase in frequency leads to the emergence of a relationship between the coefficient of electrical conductivity, dielectric permeability, and dielectric losses of water. The numerous parameters affected by electric influence demonstrate the complexity of the water treatment process using electric gas discharge and the various factors impacting it. The established patterns of changes in physico-chemical parameters outlined in the research can serve as a basis for planning water disinfection experiments.

Keywords

Electric discharge, water disinfection, physico-chemical properties, dielectric permeability, electromagnetic field, cavitation oscillations.

1. INTRODUCTION

Disinfection of surface water using electric discharge is a significant research topic in modern science and technology (Malik et al., 2001; Shang et al., 2019). Issues related to water pollution and its impact on human health and ecosystems have always been relevant. The electric discharge technology has garnered great interest as one of the methods for water purification, widely used due to its effectiveness and economic accessibility. This method aims to eliminate microbiological contaminants by altering the physico-chemical properties of water (Vanraes et al., 2016; Yang and Cho, 2017).

Corona discharge, or electric discharge, affects the structure of water clusters, generating shock waves, cavitation oscillations, and ultraviolet radiation (Abdykadyrov et al., 2023; Abdykadyrov A. et al., 2024 . These effects enable the destruction of bacteria and viruses in the water. However, to effectively implement the water disinfection process, it is necessary to identify the main factors influencing its physico-chemical properties (Petrov et al., 2021; Lukes et al., 2012; Abdykadyrov, et al., 2023). During electric discharge, characteristics such as dielectric and magnetic permeability, specific electrical conductivity, dielectric losses, and specific heat capacity of water change. These changes depend on the ionic composition of the water and external thermodynamic or electromagnetic influences. In alternating electric fields, increasing frequency leads to a relationship between the coefficient of electrical conductivity, dielectric permeability, and dielectric losses in the water (Sun et al., 2016: Abdykadyrov et al., 2023).

The purpose of this study is to analyze the main factors for efficiently organizing the disinfection process of surface water using electric discharge. During this study, the patterns of changes in the physico-chemical parameters of water were identified and their variations depending on initial parameters and external influences were examined. The results of this research will serve as a basis for planning future water disinfection experiments. Additionally, it is planned to carry out the disinfection of water using a high-frequency ETRO – 03 (13 kHz) corona discharge device. The cytotoxic effects of corona discharge and its impact on the physico-chemical properties of water have been demonstrated and described in previous studies (Astafyeva and Ivanova, 2017; Martusevich and Kovaleva, 2015). This effect is based on the formation of deep structural and functional changes in cells, leading to their death.
Before starting the water disinfection procedure, it is crucial to thoroughly investigate all factors that may influence this process to some extent. As is well-known when an electric current affects a microorganism cell, it becomes polarized and stretches towards the poles (Kakaurov, 2016; Ponomarev and Novikova, 2011; Rodionova and Novikova., 2013). Increased polarization leads to cell death. However, at low exposure levels, the opposite effect can occur, stimulating the cell and increasing its potential. Therefore, it is essential to determine how the parameters of the current passing through the water layer change to ensure maximum disinfection efficiency.

The impact of electric discharge on water is considered a complex physico-chemical phenomenon, accompanied by changes in initial parameters. This is explained by the formation of a spark above the water surface, saturation with darsonvalized oxygen, and the release of H and OH radicals. Additionally, corona discharge affects the cluster structure of water, generating shock waves, cavitation oscillations, and minor ultraviolet radiation. The objective of this study is to determine how the initial parameters change during the influence of electric discharges on water.

2. MATERIALS AND METHODS

Electric discharge on the surface of water acts as an activator of chemical reactions. Numerous theoretical and experimental studies have been dedicated to investigating the changes in the physico-chemical properties of water under the influence of electrical energy (Semikhina, 2006; Khan et al., 2012; Kuznetsova, 2010; Bessonova and Stas, 2008; Sidorenko et al., 2016). However, all these studies have been asymmetric, as they were conducted at different frequencies, temperatures, and concentrations of impurities. Among them, studies on the dependence of physico-chemical parameters on the ionic composition of water and its thermodynamic parameters induced by external influences are of great interest to us. These studies are conducted using experimental methods such as dielectric spectroscopy. The data obtained from these studies are necessary for conducting theoretical calculations aimed at planning experiments for water disinfection using electric discharges. By knowing the dielectric parameters of water, it is possible to determine the extent to which electric discharge affects microorganisms in the water, as well as the penetration depth of electromagnetic radiation.

2.1 Theoretical Calculation of Factors Influencing the Process of Water Disinfection by Corona Electric Discharge

To conduct theoretical calculations, it is necessary to consider the main factors influencing the process of water disinfection by corona discharge. These factors include the electric field, current strength, frequency, temperature, and water composition (Figure 1).

This Figure 1 describes the five main factors affecting the efficiency of corona discharge: electric field and discharge voltage, current strength, frequency, temperature, and water composition. Each factor’s impact on efficiency is explained, along with the corresponding calculation formulas. For example, higher voltage strengthens the electric field, while higher current increases the efficiency of microorganism destruction. The effects of frequency, temperature, and water composition on the corona discharge are also demonstrated.

3. RESULTS AND DISCUSSIONS

The scientific research was conducted at the Kazakh National Research Technical University named after K.I. Satbayev. The study was carried out using the ETRO-03 pilot laboratory device, based on an electric corona discharge with a voltage of 21 kV and a frequency of 13 kHz (Figure 2).

The generator of the device consists of the following elements: the ETRO – 03 pilot device (Figure 2) includes a transistor converter that converts to alternating current with a frequency of 8 – 13 kHz. The converter comprises a generator (DD1, DD2), a power amplifier (VT1), a preamplifier (VT2), and an output stage (VT3) that produces a variable voltage of 10 – 21 kV. In the multiplier (C6 – C10 and VD2 – VD6), this voltage is increased by a negative ion generator, with the ions being emitted from the needles of the coronal electrode under high voltage. The T1 transformer is wound on a 28×8 toroidal ferrite core. The primary winding (I) consists of 300 turns of PEL 00.15 mm wire, and the secondary winding (II) consists of 25 turns of PEL 00.33 mm wire. The T2 transformer is on a ferrite core from an SDCS-208 line transformer. The primary winding (I) consists of 45 turns of PEL 00.53 mm wire, and the secondary winding (II) consists of 2500 turns of PEL 00.1 mm wire. The width of the T2 winding is 10 mm, with a 50 µm thick fluoroplastic tape inserted between each layer. The T2 transformer and the multiplier are encapsulated in a 2 mm thick textolite shell and filled with paraffin. The KT812A (VT3) transistor is mounted on a heat sink, and the converter and its housing are grounded (to heating radiators or water pipes). The converter’s power supply must provide two voltages: +30 V, 280 mA and +5 V, 40 mA.

3.1 Dielectric Constant (ɛ)

One of the most important and interesting characteristics of water for us is its dipole moment, which is significantly larger compared to other liquids. This leads to a high dielectric constant (ɛ) for water. The ɛ parameter is determined by the polar properties of the molecules, temperature, concentration, and the properties of impurities. Additionally, the value of ɛ can depend on the frequency of the external field it is in. It is known that ɛ significantly decreases with increasing temperature, and at a constant temperature, ɛ decreases with increasing field frequency (the temperature coefficient for measuring dielectric permeability at 105 – 108 Hz is approximately 0.35 ºC-1) ( Khan et al., 2012).

In a wide frequency range, ɛ is characterized as a complex quantity and is expressed as a complex number consisting of the real (ɛ’) and imaginary (ɛ”) components of the dielectric constant. For each specific substance, both components of the dielectric constant show maximum variability in a certain frequency range where the oscillation period is close to the relaxation time. The presence of impurities in the water affects the value of ɛ: the presence of suspensions in the water leads to a sharp increase in the tangent of the dielectric loss angle.

The dielectric properties of distilled and fresh water are known to be the same for frequencies from 1 to 2∙104 Hz and linearly dependent on temperature in the range from 1.5°C (ɛ’ = 87) to 45°C (ɛ” = 70).

The studies conclude that with an increase in solution concentration, ɛ gradually increases to a certain limit, after which it sharply decreases (Alexandrov, 20190). Considering that fresh water is a low-concentration electrolyte solution, its ɛ is somewhat higher than that of purified water. The characteristic change in ɛ with increasing concentration is explained by the increase in the spatial volumetric charge due to the increased number of ionic carriers, resulting in deformation. Under the influence of an alternating external field, ionic charges create local fields whose direction is opposite to the vector of the applied field. The intensity of the “internal field” increases, and the dielectric permeability rises.

The water for disinfection must meet the requirements of SanPiN 2.1.4.10749-01 “Drinking water requirements.” According to these hygiene requirements for water quality, the concentration of impurities should be within the following limits: Cadmium, fluoride: no more than 0.02 mg/l; Arsenic, chlorine: no more than 0.05 mg/l; Lead, copper, iron: no more than 0.3 mg/l; Sulfur, calcium: 25-75 mg/l; Magnesium, table salt, sodium/magnesium sulfate: 200 – 250 mg/l.

In his research, measured the real dielectric permeability of fresh water at a frequency of 2.652 GHz at atmospheric pressure and various temperatures, obtaining the following dependencies (Figure 3) (Rassadkin, 2008).

This graph in Figure 3 shows the dependence of water’s dielectric permeability (ε) on temperature. It can be observed that dielectric permeability gradually decreases as the temperature increases. The initial high value at 0°C is 88.3, which decreases to 73.1 at 40°C. This change is due to the decrease in the polar properties of water molecules with increasing temperature. The curvature of the graph’s line corresponds to the given formula: y = 89.582x-0.087, which describes the exponential dependence of dielectric permeability on temperature. According to the obtained data, the temperature dependence of water’s dielectric constant is determined by the following expression (1) (Shevelev and Mikhailova, 2019):

ɛ ‘ = 89.582 · t – 0.087 (1)

3.2 Magnetic Permeability (μ)

Water is a diamagnetic substance and is classified as an “anomalous” diamagnetic material. Its ability to become magnetized under the influence of an external magnetic field is characterized by magnetic susceptibility (χm), which is associated with the positive charges (H⁺) and negative charges (O⁻) of the water molecule forming intermolecular bonds. Any change in the external environment leads to the weakening of these bonds. It is known that at a temperature of 20°C, the value of water’s diamagnetic susceptibility is ± 0.72 · 10-6 H/m. With an increase in temperature from 5 to 70°C, the change in water’s χm ranges from -2.9 · 10-6 to -0.62 · 10-6 H/m, indicating the presence of a temperature coefficient of water’s diamagnetic susceptibility.

The magnetic susceptibility of water significantly depends on the type and concentration of impurities. For instance, even naturally dissolved O2 (and in our case, direct oxygen saturation of the water surface occurs) often exhibits paramagnetism, which can surpass water’s diamagnetism because the magnetic susceptibility of the solution is determined by its ionic and molecular components and their interactions with the solvent (water). In practice, for all types of water in different frequency ranges, temperatures, and solution concentrations, magnetic permeability is usually considered a constant value, meaning that the magnetic constant μ0 is used in calculations.

The specific electrical conductivity (κ) of water is a quantitative characteristic that determines its ability to carry an electric charge, measured in Siemens per meter (Cm/m). Since natural waters belong to the second type of conductive medium, where electric charges are carried by ions under the influence of an external electric field, this indicator is directly related to the content of dissolved minerals and temperature.

The specific electrical conductivity of water and its solutions is determined by the number of ions that conduct electric current and their mobility (Shevelev and Mikhailova, 2019).

X=αCF(U_++U_-) (2)

where α is the degree of dissociation of the liquid; C is the molar concentration of the equivalent, mol/m³; F is the Faraday constant, 96,485 C/mol; U_+ and U_- are the absolute mobilities of the cation and anion (mobility in a potential gradient of 1 V/m), m²V⁻¹s⁻¹.

Thus, the purer the water, the poorer it conducts electric current. For example, at a temperature of 18°C, relatively clean water has κ = 3.8·10⁻⁶ Cm/m, whereas in purified water, due to the absence of any impurities, κ = 2·10⁻⁴ Cm/m. When discussing electrical conductivity, it is important to note the so-called critical frequency (fcr), at which displacement currents can be neglected compared to conduction currents (Table 1 and Figure 4).

This graph shows the calculated values of the critical frequency (fcr) in a liquid medium. The abscissa (x) axis of the graph represents electrical conductivity κ (S/m) in a logarithmic scale, while the ordinate (y) axis shows frequency fcr (Hz) in a logarithmic scale. The liquid media used are an aqueous solution of KCl with a concentration of 0.01 mol and double-distilled water. In this graph, we see that the frequency for the KCl solution is higher due to its higher electrical conductivity. Although the dielectric constant (ɛ) is the same for both liquid media, the value of electrical conductivity significantly affects the frequency.
Considering the complex nature of the dependence of κ on the frequency of the electromagnetic field, a value called the “quiet frequency range” is distinguished, where the properties of the liquid medium are practically independent of frequency [25,26]. For example, the quiet range for distilled and fresh water is between 107 and 3 × 10⁸ Hz. As for the temperature coefficient of electrical conductivity, it was found that for different types of water with varying degrees of impurity concentration, it ranges from 2.1% to 3.0% per 1°C. That is, with an increase in water temperature from 0 to 30°C, its κ increases by 1.7 to 2 times.
Another important factor to consider when subjecting water to electric current is dielectric losses, which are understood as the amount of energy converted into heat in an insulating material under the influence of an electric field. To describe these losses, the dielectric loss angle (𝛿) is used, which is the angle that complements the phase shift angle between current and voltage to 90° (see Figure 5) (Shevelev and Mikhailova, 2019).

The ratio of the active component of the current (Ia) to the reactive component (IR) determines the value of the tangent of the dielectric loss angle.

tgδ= I_a/I_R ∙100% (3)

The value of the dielectric loss angle usually does not exceed a few hundredths or tenths of a unit (therefore, the dielectric loss angle is often expressed as a percentage). The value of dielectric losses depends on the temperature of the water, the frequency of the applied electromagnetic field, and the composition of the impurities (Parsokhonov et al., 2022).

In his study states that for aqueous solutions with ϰ < ϰmax and γ < 0.1 mol/l concentrations, the dependence of the fmax frequency on the conductivity (ϰ) of the solutions is independent of their chemical composition (Semikhina, 2006). The individual properties of different impurity ions begin to affect the dielectric parameters of solutions only at concentrations of γ < 0.3 mol/l. In this case, increasing the concentration of impurities leads only to a shift in the dispersion region of ε and the frequency f, at which the maximum tgδ is observed. Tables 2 and 3 below show the dependencies of the dielectric constant and tgδ on frequency and temperature for relatively pure water (Shevelev and Mikhailova, 2019).

Since water has the property of heating under the influence of electric energy, which directly affects its dielectric properties, we provide the values of the specific heat capacity (Cp) of water at normal atmospheric pressure (Figure 6).

The graph shows the relationship between the specific heat capacity of water (Cp) and temperature in degrees Celsius (t0C). The specific heat capacity slightly decreases as the temperature rises from 0.1°C to 40°C. Data points are plotted in blue, with Cp values annotated at each temperature. An exponential decay equation y = 4211.2⋅e−0.005x is fitted to the data and displayed in red.3.3 Discussion of Scientific Research

The scientific research investigated the factors influencing the process of disinfecting water with corona electric discharge. The studies identified the significant impact of corona discharge on the cluster structure of water, including the formation of shock waves, cavitation oscillations, and ultraviolet radiation. Physico-chemical properties, such as dielectric and magnetic permeability, specific electrical conductivity, dielectric losses, and specific heat capacity, were examined. The patterns of changes in these properties depending on initial parameters and external influences were identified. The effects of changes in temperature and the frequency of the applied electromagnetic field were particularly noted. In alternating electric fields, the increase in frequency showed a relationship between the coefficient of electrical conductivity, dielectric permeability, and dielectric losses in water.

The numerous parameters affected by electrical influence demonstrate the complexity of the process of treating water with electric gas discharge. This complexity and the impact of many factors require consideration to enhance disinfection efficiency. The patterns presented in the study can serve as a basis for planning experiments on water disinfection. These research results contribute to the improvement of water purification technologies. Figure 7 below shows the main stages of the water disinfection process using corona electric discharge:

In this schematic diagram, special attention can be given to the main stages of the water disinfection process using corona electric discharge:

1. Structural Impact of Corona Discharge: Attention was focused on the impact of corona discharge on the cluster structure of water, including the formation of shock waves, cavitation oscillations, and ultraviolet radiation.
2. Analysis of Physico-Chemical Properties: Special emphasis was placed on the dielectric and magnetic permeability, specific electrical conductivity, dielectric losses, and specific heat capacity of water.
3. Effect of Electromagnetic Field and Temperature: The impact of temperature and the frequency of the electromagnetic field was studied.
4. Conductivity and Frequency Relationship: The relationship between the coefficient of electrical conductivity, dielectric permeability, and dielectric losses in water with increasing frequency was examined.
5. Disinfection Efficiency and Experimental Planning: Experiments were conducted considering the patterns of changes in physico-chemical parameters to enhance disinfection efficiency.
These steps help to consider all the necessary factors for effective water disinfection.

4. CONCLUSION

It has been determined that the physical and chemical characteristics of water, due to the structural composition features, change with slight external influences, whether electromagnetic, acoustic, or thermal. The scientific research examined the patterns of changes in water characteristics caused by external influences. This study reliably demonstrates that parameters such as dielectric constant, specific electrical conductivity, and dielectric losses depend to varying degrees on the concentration of impurities in the water, temperature, and the frequency of the applied magnetic field. It was found that in weak electric fields, the dielectric constant is not dependent on the intensity of the field. In the case of alternating electric fields, a relationship emerges between the coefficient of electrical conductivity, dielectric constant, and dielectric losses with increasing frequency. The presence of numerous parameters affected by electric energy indicates the complex nature of the water purification process using electric discharge, as well as the numerous factors influencing it. The established patterns of changes in the physico-chemical parameters presented in this scientific research form the basis for planning disinfection experiments with water.

REFERENCES
Abdykadyrov, A., et al., 2024. Research of the Process of Ozonation and Sorption Filtration of Natural and Anthropogenicly Pollated Waters. Journal of Environmental Management and Tourism, [S.l.], v. 14, n. 3, p. 811 – 822, june 2023. ISSN 2068-7729. Available at: <https://journals. aserspublishing.eu/jemt/article/view/7810>. Date accessed: 28 feb. 2024. doi: https://doi.org/10.14505/jemt.v14.3(67).20.https://jour nals.aserspublishing.eu/jemt/article/view/7810

Abdykadyrov, A., et al., 2023. Process of Determination of Surface Water by Ultraviolet Radiations. Water Conservation and Management, 7(2): 158-167. http://doi.org/10 .26480/ wcm.02. 2023. Pp. 158.167 https://www.watconman.org/archives-pdf/2wcm2023/2wcm2023-158-167.pdf

Abdykadyrov, A. et al., 2023. Study of the Process of Destruction of Harmful Microorganisms in Water. Water 2023, 15(3), 503; https://doi.org/10.3390/w15030503 https://www.mdpi. com/ 2073-4441/15/3/503

Abdykadyrov, A., Marxuly, S., Mamadiyarov, M., Smailov, N., Zhunusov, K., Kuttybaeva, A., Orazbekov, A., 2023.Investigation of the Efficiency of the Ozonator in the Process of Water Purification Based on the Corona Discharge. J. Ecol. Eng. 2023; 24(2): Pp. 140-151 DOI: https://doi.org/10.12911/22998993/156610 http://www.jeeng.net /Investiga tion-of-the-Efficiency-of-the-Ozonator-in-the-Process-of-Water-Purification,156610,0,2.html

Alexandrov, V. V., 2019. Electrophysics of fresh waters , Electronic resource. Access mode: http://elib.rshu.ru/files_books/pdf/img-216170906.pdf , accessed 05/17/2019.

Astafyeva, K. A., and Ivanova, I. P., 2017. Analysis of the cytotoxic effect of medical gas discharge devices //Modern technologies in medicine. – 2017. – vol. 9. – No. 1. – Pp. 115-122.https://cyberleninka.ru/article/n/ analiz-tsitotoksicheskogo-deystviya-meditsinskih-gazorazryadnyhustr oystv/viewer

Bessonova A. P., Stas, I. E., 2008. The influence of a high-frequency electromagnetic field on the physicochemical properties of water and its spectral characteristics // Polzunovsky vestnik, 2008. No. 3. Pp. 305-309. https://cyberleninka.ru/article/n/vliyanie-vysokochastotnogo-elektromagnitnogo-polya-na-fiziko-himicheskie-svoystva-vody-i-ee-spektralnye-harakteristiki/viewer

Kakaurov S. V., 2016. Application of a pulsed power supply for disinfection of water by diaphragm electric discharge: abstract of the dissertation for the degree of Candidate of Technical Sciences Place of protection: National research volume of the Polytechnic University. un-T. Tomsk, 2016. Pp. 22 . https://earchive.tpu.ru/bitstream/11683/37504/1/dis0 0143.pdf

Kalandarov, P. I., 2022. High-frequency moisture meter for measuring the humidity of grain and grain products. 2022. № 4. Pp. 65–71. https://doi.org/10.32446/0368-1025it.2022-4-65-71

Kalandarov, P.I., 2021. Estimate of precision of thermogravimetric method of measuring moisture content: estimate of precision and effectiveness gained with the use of the method in the Agro-Industrial Complex. Measurement Techniques, Vol. 64, No. 6, September, 2021. Pp.522-528. DOI 10.1007/s11018-021-01963-9

Khan V. A., Vlasov V. A., Myshkin V. F., Ijoikin D. A., Rakhimzhanova L. A., 2012. Investigation of the influence of electromagnetic fields on the structure and properties of water // Polythematic network electronic Scientific Journal of the Kuban State Agrarian University. No. 81. 2012. Pp. 115-127. https://cyberleninka.ru/article/n/issledovanie-vliyaniya -elektromagnitnyh-poley-na-strukturu-i-svoystva-vody/viewer

Kuznetsova, S. Yu., 2010. Magnetic properties of water // Successes of modern natural science. No. 10. pp. 49-51. https://s.natural-sciences.ru/pdf/2010/10/11.pdf

Lukes, P., Brisset, J. L., Locke, B. R., 2012. Biological effects of electrical discharge plasma in water and in gas–liquid environments //Plasma chemistry and catalysis in gases and liquids. – 2012. – С. 309-352. DOI:10.1002/9783527649525

Malik, M. A., Ghaffar, A., and Malik, S. A., 2001. Water purification by electrical discharges //Plasma sources science and technology. – 2001. – Т. 10. – №. 1. – С. 82. DOI 10.1088/0963-0252/10/1/311

Martusevich A. A., Kovaleva L. K., 2015. Investigation of the effect of sources of reactive oxygen species on the physico-chemical properties of water //Bioradicals and antioxidants. – vol. 2. – No. 2. – Pp. 48-51. https://cyberleninka.ru/article/n/issledovanie-deystviya-istochnikov -aktivnyh-form-kisloroda-na-fiziko-himicheskie-svoystvavody/viewer

Parsokhonov, A., Kalandarov, P., Olimov, O., Akhmedov, A., 2022. Device for generating electrical energy based on thermal expansion of a solid material. IOP Conference Series: Earth and Environmental, 2022, 1076(1), 012010 doi:10.1088/1755-1315/1076/1/012010

Petrov O. et al., 2021. Neutralization of Industrial Water by Electrodialysis //Membranes. – 2021. – Т. 11. – №. 2. – С. 101. https://doi.org/10.3390 /membranes11020101

Ponomarev A. N., Novikova G. V., 2011.Installation for ultrahigh frequency disinfection of milk // Bulletin of the I. Ya. Yakovlev Chuvash State Pedagogical University. 2011. No. 2-1 (70). Pp. 123-127.https://cyberleninka.ru/article/n/ustanovka-dlya-sverhvysokoch astotn ogo-obezzar az hivaniya -moloka/viewer

Rassadkin, Yu. P., 2008. Ordinary and unusual water. M.: Gallery HUNDRED. 2008. 840 Pp. UDC: 543.3

Rodionova A.V., Novikova G. V., 2013. Justification of the operating modes of the milk disinfection unit // Bulletin of the I. Ya. Yakovlev Chuvash State Pedagogical University. 2013. No. 4-2 (80). Pp. 186-189. https://cyberleninka.ru/article/n/obosnovanie-rezhimov-raboty-ustanovki-dlya-obezzarazhivaniya-moloka/viewer

Semikhina L. P., 2006. Dielectric and magnetic properties of water in aqueous solutions and biological objects in weak electromagnetic fields. – Publishing house of the Tyumen State University, 2006. ISBN: 5-88081-509-9, UDC: 538.95

Shang K., Jie L. I., Morent, R., 2019. Hybrid electric discharge plasma technologies for water decontamination: a short review //Plasma Science and Technology. – 2019. – Т. 21. – №. 4. – С. 043001. DOI 10.1 088/2058-6272/aafbc6

Shevelev, A. V., Mikhailova, O. V., 2019. Review of Factors Affecting the Water Disinfection Process by Corona Discharge //Vestnik NGIEI. – 2019. – No. 7 (98). – Pp. 50-58. https://cyberleninka.ru/article/n/ob zor-faktorov-vliyayuschih-na-protsess-obezzarazhivaniya-vodykoronn ym-elektrorazryadom/viewer

Sidorenko, G. N., Laptev B. I., Gorlenko N. P., Sarkisov Yu. S., Antoshkin L. V., 2016. Possibilities of electrophysical research methods and thermometry for assessing the structure of aqueous media (solutions, plant and animal objects) // Bulletin of new medical technologies. Electronic edition. 2016. No. 2. Pp. 233-243. https://cyberle ninka.ru/article/n/vozmozhnosti-elektrofizicheskih-metodov-issledovaniya-i-termometrii-dlya-otsenki-struktury-vodosoderzhaschih-sred-rastvorov/viewer

Sun, J., Wang, W., Yue, Q., Ma, C., Zhang, J., Zhao, X., and Song, Z., 2016. Review on microwave–metal discharges and their applications in energy and industrial processes //Applied Energy. – 2016. – Т. 175. – С. 141-157. https://doi.org/10.1016/ j.apenergy.2016.04.091

Vanraes, P., Nikiforov, A. Y., Leys, C., 2016. Electrical discharge in water treatment technology for micropollutant decomposition //Plasma science and technology–progress in physical states and chemical reactions. – 2016. – С. 428-478. https://books.google.kz/books?hl =ru&lr=&id= imqQDwAAQBAJ&oi=fnd&pg=PA429&dq=Disinfection+of+surface+water+by+electric+discharge+is+an+important+research+topic+in+the+field+of+modern+science+and+technology.&ots=j5ieiqT6F3&sig=AB_xHJIg1KAsGY76mrH4ZrU2_5w&redir_esc=y#v=onepage&q&f=false

Yang Y., Cho Y. I., 2017. Fridman A. Plasma discharge in liquid: water treatment and applications. – CRC press, 2017. https://books.google.kz/ books?hl=ru&lr=&id =HglEDw AAQBAJ &oi=fnd&pg= PP1&dq=Disinfection+ of+surface+water+by+ electric+discharge+is +an+important+research +topic+in+the+field +of+modern+science +and+ technology. &ots= M6NrKNIWhd &sig=FiohmKmasTlknxMbT5-fLAWNQZ8 &redir_ esc=y#v= onepage& q&f= false

Pages 01-06
Year 2025
Issue 1
Volume 9

Download

Water Conservation and Management (WCM)

wcm.04.2024.487.494

WATER QUALITY AND TROPHIC STATUS IN WIDAS RESERVOIR, EAST JAVA,
INDONESIA

Journal: Water Conservation and Management (WCM)
Siti Nurul Aida, Agus Djoko Utomo, Mohammad Zaidan, Midranisiah, Railia Karneta, Krisna Delita, Tuah Nanda M. Wulandari, and Ulung Jantama Wisha
Print ISSN : 2523-5664
Online ISSN : 2523-5672

This is an open access article distributed under the Creative Commons Attribution License CC BY 4.0, which permits unrestricted use, distribution, and reproduction in any medium, provided the original work is properly cited

Doi: 10.26480/wcm.04.2024.487.494

Abstract

Widas Reservoir is a multifunctional resource with potential for fisheries, but its water quality can be significantly affected by various activities. This research aims to determine the status of trophic levels and water quality, which is crucial for water resource management and conservation. The study involved a comprehensive field survey with sampling at various points, considering the inlets, outlets, and conservation zones. The research found that the average water depth was 10.9 meters, transparency was 511 centimeters, CO2 concentration ranged from 0.0 to 17.6 mg/L, DO ranged from 0.1 to 8.2 mg/L, and temperature ranged from 25 to 31.1°C. In addition, temperature and DO decrease with depth, in contrast to CO2, which tends to increase with depth. The average conductivity was 150.3 μmhos/cm, total alkalinity was 103.1 mg/L, turbidity was 63 NTU, pH ranged from 6 to 8, and phosphate (PO4) concentration averaged 28.74 μg/L. TP average was 33.39 μg/L, and Chlorophyll-a averaged 21.75 μg/L. The Trophic Status Index (TSI) showed a high fertility (eutrophic) level with an average index value of 63.8. The potential for fish production was high at 626.6 kg/ha/year.

Keywords

Trophic Status Index, Water Quality, Widas Reservoir.

1. INTRODUCTION

Widas Reservoir covers an area of 500 ha in East Java, Indonesia and it has multipurpose for agriculture, fisheries, hydropower, recreation, flood control, and others. Fishery activities in the reservoir include aquaculture in floating net cages and fishing activities. The water quality in reservoirs is influenced by anthropogenic activities in the reservoir and the surrounding environment (Ummenhofer and Meehl, 2017; Aida et al., 2022). Widas Reservoir is essential for supporting the fish stock and can contribute to the local community’s economy. The average catch is about 283 tons/year, consisting of the following fish species: Cyprinus carpio, Barbonymus gonionotus, Oreochromis niloticus, Pangasianodon hypophthalmus, Notopterus notopterus, Osteochilus vittatu, and Rasbora spp. Concerning fish sustainability, the water quality in the Widas Reservoir needs to be further controlled (Aida et al., 2022).

Several activities that affect water quality in reservoirs include residential activities, recreation, land use in water catchment areas, floating net cages, aquaculture, and sedimentation. Household waste from residential areas and floating net cages for fish culture entering reservoir waters can deteriorate water quality and induce eutrophication. Sediment supply entering the reservoir can cause siltation and increase water turbidity (Cunha et al., 2021; Schleiss et al., 2016; Aida et al., 2023). Monitoring water quality is vital for future management because current conditions and emerging problems can be detected early, and water benefits can be protected. Fish and their habitats are very dependent on the conditions of the aquatic environment (Stela et al., 2010; Rocha et al., 2015).

Water physicochemical parameters, such as pH, temperature, turbidity, dissolved oxygen, total phosphorus, and phosphate, are commonly used to determine water quality (Xiao et al., 2016; Huang et al., 2015). Assessing the status of water conditions aims to overcome several environmental problems, such as water pollution, habitat degradation, and ecological changes (Prabhakaran et al., 2017; Aida et al., 2022; Umi Wahidah et al., 2020). On the other hand, organic material pollution can cause eutrophication (EPA 2000 in Tas, 2012; Ayoade et al., 2019). The level of eutrophication can be assessed through physical, chemical, and biological examination of water (Carlson, 1977; Sivaranjani et al., 2015). This research aims to assess water quality criteria, trophic state index (TSI), and the production potential of Widas Reservoir to manage its fish resources sustainably. The information obtained guides strategies to control eutrophication and sustainable fishery resources.

2. MATERIALS AND METHODS

2.1 Study Site And Sampling Time

This research was conducted in Widas Reservoir, Madiun Regency, East Java Province, Indonesia (Figure 1) from March, May and September 2021. Sampling was carried out at locations that represent habitat types: Observation stations are “Centre” (Station 1), representing the habitat in the middle of the reservoir; “Conservation area” (Station 2), representing the conservation habitat, “Muara Petung” (Station 3) and “Muara” (Station 4) are the inlet habitat, “Pintu Air” (Station 5) representing the outlet habitat and “Kali Bening” (Station 6) representing the inlet habitat.

2.2 Water Quality Parameters and Analysis

Water quality parameters measured in situ include transparency (cm), carbon dioxide (CO2), dissolved oxygen/DO (mg/L), temperature (℃), conductivity (μS/cm), total alkalinity (mg/L), turbidity (NTU), and pH. The parameters analyzed in the laboratory are orthophosphate (mg/L), total phosphate (mg/L), and chlorophyll-a (mg/m3) (Table 1).

Water transparency is an indicator of the status of water fertility levels. The transparency value depends on the weather conditions, measurement time, watercolor, turbidity, and suspended solids in the water (Effendi, 2003). On the other hand, the determination of the trophic state of the waters is based on physical (transparency measured by Secchi disk depth), chemical (total phosphorous), and biological conditions (chlorophyll-a).

Water quality parameters were analyzed using a descriptive method using tables and graphs based on sampling locations and water depths, so that differences in water quality can be identified based on location and depth.

2.3 Trophogenic Layer

Trophogenic layer estimation uses transparency parameters, and the brightness value seen on the Secchi disk instrument means that only 10 % of sunlight enters the water. Meanwhile, phytoplankton can still assimilate at the level of 1% of sunlight entering the waters, so the estimation of the depth of the photic layer based on (Williams and Mann, 2024) is as follows:

2.4 Trophic Status Analysis

The trophic state of the waters was analyzed by calculating the value of the trophic state index (TSI) formulated by (Carlson, 1977):

Based on the TSI value, the trophic state of lake/reservoir waters is classified into four levels: Oligotrophic (low eutrophication), mesotrophic (moderate eutrophication), eutrophic (high eutrophication), and hypereutrophic (very high eutrophication) (Table 2).

2.5 Fish Production Potential

Fish production potential is the ability of a water body to produce fish. The estimation of fish production potential is estimated using the chlorophyll-a content parameter in the waters, using the formula from Almazan and Boyd in Boyd (1990):

3. RESULTS

3.1 Water Quality

Based on the results of water depth measurements with a depth sounder, the water depth of the Widas Reservoir ranges from 2 to 23 m, with an average of 10.72 m. The most profound depth is at the station around the outlet and the shallowest part is at the inlet. Based on water transparency measurements using a Secchi disk, the transparency of the Widas Reservoir water ranges from 0.49 m to 0.57 m with an average of 0.511 m (Figure 2; Table 3). The transparency value of the Widas Reservoir is low, with an average of only 0.511 m, explicitly indicating eutrophic water condition.

Photic (C) = (A +0.495)/0.117

Aphotic (D = B – C)

Figure 3 shows the pattern of CO2 and DO concentrations in the waters of the Widas Reservoir. The concentration of free CO2 ranged from 0.0 to 17.6 mg/L. The range of free CO2 at the surface (0 m) was between 0.0-0.79 mg/L, and at a depth of 3 m to near the bottom of the water ranged from 6.16 to 17.6 mg/L. Free CO2 at Central Station (Station 1) ranged from 0.74 – 6.16 mg/L, at Widas Sanctuary (Station 2) ranged from 0.44-7.04 mg/L, at Stations 3 and 4 in the Inlet Muara Petung ranged from 0.74-6.16 mg/L, at the Outlet and Inlet Kali Bening (stations 5 and 6) ranged from 0.53-8.8 mg/L.

On the other hand, the range value (DO) at the surface (0 m) was between 5.1-8.2 mg/L on average 6.79 mg/L. at the 1 m depth, it ranged from 3.6-7 mg/L, on average 5.87 mg/L; at 3 m depth, it ranged from 3.12-6.8 mg/L, on average 5.0 mg/L; at the 5 m depth, it ranged from 0.2-6.0 mg/L on average 2.67 mg/L, and at the bottom waters it ranged from 0.1-1.5 mg/L on average 0.47 mg/L.

The water temperature of Widas Reservoir ranged from 25 – 31.1℃. The temperature range at the surface (0 m) was between 28.1 – 31.1℃, on average 29.83℃ and at the 1m depth ranged from 27.9 – 30.8℃, on average 29.74℃; at the 3 m depth between 27-30.6℃, on average 28.63℃; at the 5 m depth, it ranged from 25-30.0℃, on average 27.51℃, at the bottom waters, it ranged from 25-29℃ on average 26.99℃ (Figure 4). The temperature in the waters of Widas Reservoir decreased with an increasing depth of about 2.1 ℃in March, 3.2 ℃ in May, and 3.45 ℃ in September.

Figure 5 shows the electric conductivity (EC) measurements results in Widas Reservoir waters ranging from 61-266.7 μS/cm with an average of 150.3 μS/cm. In March, it ranged from 70.5-108 μS/cm; in May, it ranged from 135-157.1 μS/cm; in September, it ranged from 157-221.1 μS/cm.

The consistent pH distribution was almost the same in the vertical water column. The pH value at the bottom of the water ranged from 6-6.8. The pH value in surface waters ranged from 7.3-8. (Table 4). Fluctuations in the pH of the Widas Reservoir waters between observation times and sampling points at various depths did not change too much. Furthermore, the pH of the water tended to be low or acidic as the depth increased.

3.2 Trophogenic Layer

The transparency value of each sampling location did not differ much between 0.45 m and 0.57 m. However, the depth of each sampling location varied from 4.3 m to 23 m. The shallowest depth was at the inlet of Muara Petung (Station 3). The deepest one was at the outlet (Station 5). The photic and aphotic layers differed at each location (Table 3). The photic layer reaches the bottom of the waters. There is no aphotic layer, namely Station 3 (Muara Petung), Station 4 (Muara Inlet), and Station 6 (Kali Bening). At the same time, Station 5 (outlet) is the location that has the thickest aphotic layer (13.89 m); in the aphotic layer, sunlight cannot enter, and it is dark).

3.3 Trophic status in Widas Reservoir

The nutrient concentrations determined for Widas Reservoir are presented in Table 4. The PO43 concentration varied from 5.25‒62.96 µg/L and averaged 28.39 µg/L (mesotrophic). The minor average at the surface was 5.25 (µg/L) at Station 1 (Muara Petung), and the highest at the bottom was 62.96 (µg/L) at Station 5 (Outlet). The phosphate content at the bottom of the water was higher than on the surface. The concentration of total phosphor (TP) on the surface ranged from 26.1‒38.46 µg/L with an average of 33.84 µg/L and at the bottom of the waters ranged from 38.81‒150.27 µg/L with an average of 86.02 µg/L (eutrophic). The total phosphor (TP) content at the bottom of the water was higher than on the surface (Table 4). The total chlorophyll-a content in the surface ranged from 19.49 to 59.93 μg/L with an average value of 33.57μg/L (eutrophic) (Table 4). The Chlorophyll-a content in the surface layer was higher than at the bottom of the water.

The Trophic State Index (Table 5) value from the measurement of Secchi disk, Chlorophyll-a concentration, and total phosphorus (TP) of Widas Reservoir is 60.2-67.4. The average TSI value of 63.76 indicates that the status index of water is eutrophic. TSI in Widas Reservoir is as follows: Station 1 (Center) = 63; St.5 (Outlet) = 63.2; Station 2 (Conservation) = 60.2; Station 3 (Inlet Muara) = 61.6; Station 4 (Inlet Muara) = 67.2; and Station 6 (Kali Bening) = 67.4.

3.4 Fish Production Potential

Fish production potential is calculated based on the chlorophyll content in the waters. The higher the chlorophyll content, the higher the potential value of fish production. The potential value of fisheries production in Widas Reservoir is relatively high, ranging from 421.56 to 929.7 kg/ha/year, with an average value of 628.6 kg/ha/year. The highest is Station 3 (Muara Petung), and the lowest is Station 2 (conservation area) (Table 6).

4. DISCUSSION

4.1 Water Quality Status and Trophogenic Layer in Widas Reservoir

Based on its depth and breadth, Widas Reservoir has excellent potential for fishing (Aida et al., 2023). The reservoir has a wide littoral area, and water level fluctuations are large, so the littoral area has natural food sources such as benthos and water insects. Therefore, environmental management of reservoir waters is critical (Noori et al., 2018; Woldeab et al., 2023). Water transparency is an indicator of water fertility status. The water transparency ranged from 0.45 to 0.57 m, on average 51 cm (Table 3). Low transparency is included in the category of eutrophic waters.

Transparency highly depends on turbidity and suspended solids in the water (Effendi, 2003). Waters with high sedimentation tend to have low transparency. For example, the Gadjah Mungkur Reservoir has a transparency range of 7-54 cm (Utomo, 2013). Reservoir waters generally have low transparency below 100 cm. For example, Rawa Pening has a water transparency value range of 60-80 cm (Aida and Utomo, 2016), and Bukit Merah Reservoir, Malaysia has a transparency value range of 18 – 87 cm (Zakeyuddin et al., 2016).

Transparency is a physical parameter closely related to photosynthesis in an aquatic ecosystem. High transparency indicates the penetrating power of sunlight far into the water, the part of the light transmitted into the water and expressed in (%), the possibility of assimilation processes in water (Brezonik et al., 2019). Clearwater is suitable for aquatic life, including fish. Therefore, the transparency value of Widas Reservoir is still suitable for fish life.

CO2 concentration in waters depends on various factors, including assimilation, decomposition processes, and respiration of plants, animals, and aerobic and anaerobic bacteria (Aida & Utomo, 2016; Wetzel, 2001) due to the processes of respiration and photosynthesis. The content of CO2 and DO in the water will generally be inversely proportional during the day in the surface layer of reservoir waters. CO2 is very low and can reach 0.0 mg/L, while DO is high. Conversely, at night and deeper in the water, The CO2 levels are relatively higher. The oxygen content will decrease more in the bottom layer of the water because sunlight decreases in the bottom layer, so the photosynthesis process will also decrease, and oxygen production will also decrease.

On the other hand, the carbon dioxide content on the water’s surface is smaller than in the bottom layer (Figure 3) because carbon dioxide on the water’s surface is widely used in photosynthesis. At the bottom of the water, the photosynthesis is minimal. Much organic material decomposes at the bottom of the water, producing carbon dioxide.

Oxygen concentration will be higher during the day and at the surface. Likewise, according to the results of other studies, the deeper the water, the lower the oxygen concentration, such as in Pondok Reservoir, ranging between 6.72-9.52 mg/L (Aida and Utomo, 2016). In Gadjah Mungkur Reservoir, it ranges from 7.9-3.74 mg/L (Utomo, 2013); in Angereb Reservoir, Ethiopia, it ranges from 5.1-6.18 mg/L (Gobeze et al., 2023). CO2 and DO are directly related to the life of aquatic biota, even becoming a limiting factor. Water DO values close to 0.0 mg/L and high CO2 at the bottom of the water can cause fish death. The carbon dioxide and oxygen content in the photic layer in Widas Reservoir is still suitable for fish life.

Figure 4 shows a decrease in temperature with increasing depth because the heat energy received by deeper waters is getting smaller. The decrease in water temperature based on water depth has not shown apparent symptoms of stratification. However, it is necessary to be aware if there is prolonged heavy rain so that the surface temperature is lower than the bottom of the water. At low temperatures, the water will have a higher specific gravity so that the surface water will fall to the bottom, and the water at the bottom will rise. The vertical water mass transfer is well-known as upwelling.

Widas Reservoir water temperature is still good enough to support fish life. Temperature measurements down to the bottom layer of water at a depth of 15 meters, despite a decrease in temperature, are still typical for fish life. The temperature value is still in the optimum temperature range for the growth of biota in the waters, which is between 20 to 30℃ and is a typical freshwater surface temperature in the tropics. Temperature can affect organisms’ metabolic activity, so organisms’ distribution in the water relies on the temperature of the water (WHO, 2017).

Conductivity is the ability of water to transmit electric current—the more the dissolved salts, minerals, and ions, the greater the conductivity value. Natural waters generally have a conductivity content ranging from 20 to 1500 µS/cm. Sea water usually has higher conductivity because it has a higher salt content. The conductivity value of Widas Reservoir ranges between 75 to 250 µS/cm (Figure 5). The highest is observed in the dry season (September) when the lower water volume occurs, so the dissolved minerals and ions are more concentrated. The EC value in Widas Reservoir is still suitable for fish life.

The conductivity in Gadjah Mungkur Reservoir, Indonesia, is above 250 µS/cm (Aida et al., 2022). The electrical conductivity value at the Ketiwon River estuary ranges from 516 µs/cm to more than 1999 µs/cm. The highest is at high tide because it is greatly influenced by seawater, and the lowest is at low tide due to the influence of fresh water from the river (Lisa et al., 2023). Conductivity in Rudrasagar Lake Tripuya-India ranges between 60 µS/cm at the surface and 80 µS/cm at a depth of 4 m. The lake is oligotrophic with poor nutrients (Mihir et al., 2015). Compared to the EC value of Gajah Mungkur Reservoir, which is above 250 µS/cm (Aida et al., 2022). Conductivity in industrial waste can reach 10.000 µS/cm (Apha, 2012). High EC values may also be related to extensive agricultural activities around the area and improper sewage discharge (Gobeze et al., 2023). The EC value in this study still ranges between 200 to 800 µS/cm, which is permitted for drinking water (WHO, 2017).

The pH in the bottom layer of water tends to be low or acidic compared to the surface due to the influence of the decomposition of organic material at the bottom of the water, which will produce gases such as CO2 and H2S, which can lower the pH. In line with other reservoir waters, namely: pH in Pondok Reservoir 7‒8 (Aida et al., 2021), Gadjah Mungkur Reservoir 6‒8 (Utomo, 2013), Sempor Reservoir 6.3‒8.4 (Shaleh et al., 2014), Bukit Merah Reservoir 6.2‒6.7 (Zakeyuddin et al., 2016), Gilgel Reservoir Ethiopia 7.2‒8.1 (Woldeab et al., 2023). In Angereb Reservoir Ethiopia 7.32‒8.00 (Gobeze et al., 2023). Overall, the pH value is neutral-alkaline, indicating hydrolysis of HCO3- and CO2-3 and production of OH- (Boyd, 2015). However, the pH value in the study area is within safe limits up to the limits set by WHO (2017) and Regulations Government No. 22 of 2021 (PP 22/2021).

The Photic layer is where sunlight still penetrates so that the process of photosynthesis still occurs. Therefore, in this layer, the biota still has a lot of dissolved oxygen that the biota can utilize. The aphotic layer is a layer where very little sunlight enters. Therefore, photosynthesis does not occur in the aphotic layer; it is poor in oxygen, and there are many toxic materials at the bottom of the waters, such as carbon dioxide and ammonia (Wetzel, 2001). Water with a thick aphotic layer will one day cause environmental problems if there is a water reversal from the upper layer down to the bottom and from the lower layer up (upwelling). Then, rotten organic matter and toxins at the bottom of the water will be lifted to the top and cause mass fish deaths, especially fish in floating net cages (Utomo, 2013; Utomo et al., 2019). Upwelling occurs when there is heavy rain at night so that the surface temperature of the water is frigid and the specific gravity of the water will be greater so that the surface layer will drop down and the bottom layer of the water will rise (Odum, 1996).

4.2 Trophic Status and Fish Production in Widas Reservoir

The phosphate content at the bottom of the water is higher than on the surface due to much precipitation at the bottom of the water. Based on this phosphate concentration, the waters are classified as mesotrophic (Wetzel, 2001). The phosphate content in Angereb Reservoir Ethiopia 14.8-26.75 µg/L (Gobeze et al., 2023), Bukit Merah Reservoir 0.025-0.72 mg/L (Zakeyuddin et al., 2016), Sempor Reservoir 0.2-21 µg/L (Shaleh et al., 2014), In Gadjah Mungkur Reservoir 5.2 – 115 µg/L (Utomo, 2013), Taizhou Reservoirs, East China 0.01-0.05 mg/L (Yin et al., 2021). Bukit Merah Reservoir 0.04-0.109 mg/L (Zakeyuddin et al., 2016), Pondok Reservoir 11-56.7 µg/L (Aida et al., 2022).

The presence of phosphorus in natural waters is relatively small and quickly settles to the bottom, so it is a limiting factor for algae growth. The presence of high phosphorus is an indicator of organic material pollution (Novotony and Olem, 1994). The large amount of organic material that settles at the bottom of the water will cause the layer at the bottom to become more acidic than at the surface. The average value of total phosphorus shows that the water status of the Widas Reservoir is eutrophic (Carlson, 1977). The concentration of Widas Reservoir TP is still suitable for aquatic life, especially fish. The TP content of the Widas Reservoir enters through the runoff of the Inlet Muara Petung and Inlet Kali Bening. The catchment area contains a lot of intensive agriculture and waste from fish farming and other activities in the reservoir. Because the Widas Reservoir is also a source of drinking water, it must be processed first before being used so that it is suitable for drinking water.

The chlorophyll-a content in the surface layer is higher than at the bottom of the water because sunlight does not reach the bottom. Dark waters with little sunlight will be poor in algae, whereas chlorophyll is found in algae. Based on the average value of chlorophyll-a in Widas Reservoir, in general, the status of these waters is eutrophic (Carlson, 1977; Wetzel, 2001). This state is due to the enrichment of nutrients (eutrophication), especially phosphorus and nitrate elements in the waters. Chlorophyll-a also indicates high eutrophication processes and algae growth in water bodies. According to Novotony and Olem (1994) oligotrophic waters if the chlorophyll content is <4 μg/L mesotrophic if the chlorophyll content is between 4-10 μg/L and eutrophic if the chlorophyll content is >10 μg/L. In Gadjah Mungkur Reservoir, the chlorophyll-a value ranges between 3.57 – 83.3 μg/L with an average value of 21.31 μg/L (Utomo, 2013). The Angereb reservoir, Ethiopia, ranges from chlorophyll-a concentrations of 3.89-6.01 µg/L (Gobeze et al., 2023). Bukit Merah Reservoir chlorophyll-a 0.085- 0.39 µg/L (Zakeyuddin et al., 2016).

The average TSI value is 63.6, indicating that the status index of water is eutrophic. Reservoirs are characterized as inland waters, open access, and lentic water, so their activities greatly influence water quality: the catchment area and activities in the waters themselves. Reservoirs are stagnant waters (lentic) whose water quality status is influenced by the activities around them. The catchment area and the activities in the waters themselves (Klippel et al., 2020;). Eutrophic status indicates that the waters have received a lot of organic material input from the surrounding environment (Wetzel et al., 2021; Wiegand et al., 2021). Since the reservoir waters are eutrophic in developing fish farming in reservoirs, it is recommended not to use artificial feed (pellets). It is better to use natural feed (water plants that fish and maggots can eat) (Utomo et al., 2019).

Fish production potential is 626.6 kg/ha/year due to the high concentration of chlorophyll. High chlorophyll indicates that the waters have a lot of phytoplankton, which is a natural fish food. Based on the analysis, the maximum sustainable yield (MSY) value of fish in the Widas Reservoir is 542.4 kg/ha/year; thus, the sustainable potential of fish in the utilization of fish resources in Widas Reservoir could be increased to 626.6 kg/ha/year by spreading/restocking phytoplankton-eating fish, thereby increasing the fishermen’s catches.

5. CONCLUSION

Based on the Trophic Status Index (TSI) Widas Reservoir is categorized into eutrophic water with an average index of 63.6. Several water quality parameters that decrease towards the bottom of the water are temperature, oxygen, and pH. Meanwhile, the parameters that increase towards the bottom of the waters are carbon dioxide and turbidity. Overall, the water quality of the Widas Reservoir waters is still suitable for the life of freshwater fish. Because of the eutrophic water state, so the use of reservoir water for drinking water should be undergoing such treatments before it can be consumed by local society. Likewise, the use of natural foods for fish farming could also reduce the rapid growth of algae due to the impact of eutrophication. Therefore, fisheries activities are prioritized for the stocking of algae-feeder fish. The potential for fish production is relatively high at 626.6 kg/ha/year, with the potential to increase the production of fishermen’s catches by stocking plankton-feeder fish.

ACKNOWLEDGMENT

The author would like to thank: Research Institute for Inland Fisheries and Fisheries Extension Palembang for funding this research activities. Gratitude is also given to the research team for writing this manuscript and to fellow researcher and technicians who have helped a lot during the implementation of this research from the field survey up to the laboratory analysis.

CONFLICTS OF INTEREST

Authors declare no conflict of interest

REFERENCE

Aida, S.N, Utomo, A.D., 2012. Trophic status of Kedung Ombo Reservoir in Central Java. Jurnal Widya Riset Perikanan Tangkap Jakarta. 4(1): Pp. 59 – 66. [In Indonesian].

Aida, S.N., Ridho, M.R., Saleh, E., Utomo, A.D., 2022. Distribution of phytoplan kton based on the water quality of Bengawan Solo River, Central Java. AACL Bioflux. 15(2):Pp. 641-651.

Aida, S.N., Ridho, M.R., Saleh, E., Utomo, A.D., Nurhayati. 2021. Estimation of Growth Parameter on Sailfin Catfish (Pterygoplichthys pardalis) in Benga wan Solo River, Central Java Province. IOP Conference Series: Earth and Environmental Science. 695 (1), Pp. 10. https://doi.org/10.1088/1755-1315/695/1/012027.

Aida, S.N., Utomo, A.D., 2016. Assessment of water quality for fisheries in Rawa Pening Centre of Java. Bawal. 8:Pp. 173-82. [In Indonesian].

Aida, S.N., Utomo, A.D., Anggraeni, D.P., Ditya, Y.C., Wulandari, T.N.M., Ali, M., Caipang, C.M.A., Indra, S., 2022. Distribution of Fish Species in Relation to Water Quality Conditions in Ben gawan Solo River, Central Java, Indonesia. Pol. J. Environ. Stud. 31 (6): Pp. 1-13. https://doi.org/10.15244 / pjoes/152167.

Aida, S.N., Utomo, A.D., Safran, M., Wulandari, T.N.M., Fatah, K., Yosmaniar, Suharman, I., Wisha, U.J., 2024. Acoustic-based estimation of fish stocks in Widas Reservoir, East Java, Indonesia. Fisheries and Aquatic Sciences. 27 (4): Pp. 240-255. https: //doi.org/10.47853/FAS.2024.e24.

American Public Health Association (APHA)., 2012. Standard Method for the Examination of Water and Waste water. 22nd ed. American Public Health Association/American Water Work Association/Water Environment Feder ation, Washington, DC, USA.

Ayoade, A.A., Osuala, B.O., Adedapo, T.A., 2019. Physico-chemical parameters, chlorophyll-a and phytoplankton comm unity as trophic state indices of two tropical lakes, southwestern Nigeria. Eurasia Journal Bioscience. 13: Pp. 1-8.

Boyd, C.E., 2015. Water Quality Particulate Matter, Color, Turbidity, and Light.10 .1007/978-3-319-17446-4. 101–112.

Boyd, C.E. 2019. Water Quality Ed.3. Spri nger Nature. ISBN: 3030233359, 978 3030233358. 440.

Brezonik, P.L., Bouchard, J.R.W., Finlay, J.C., Griffin, C.G., Olmanson, L.G., Anderson, J.P., Arnold, W.A., Hozalski, R., 2019. Color, chlorophyll a, and suspended solids effects on Secchi depth in lakes: implications for trophic state assessment. Ecol Appl. 29: e01871.https://doi.org/10.1002/eap.1871.

Carlson, R.E., 1977. A trophic state index for lakes. Limnological Research Centre. Univ. Of Minnesota. Minneapolis. 22 (2): Pp. 361-369.

Cunha, D.G.F., Finkler, N.R., Lamparelli, M.C., Calijuri, M.D.C., Dodds, W.K., Carlson, R.E., 2021. Characterizing Trophic State in Tropical/Subtropical Reservoirs: Deviations among Indexes in the Lower Latitudes. Environmental Management. 68, Pp. 954-954.Ht tps:// doi.org/10.1007/s00267-021-01521-7.

Dini, U.W.A., Yusoff, F.M.D., Aris, A.Z., Sharip, Z., Sinev, A.Y., 2020. Planktonic microcrustacean comm unity structure varies with trophic status and environ mental variables in tropical shallow lakes in Malaysia. Diversity. 12(9): Pp. 322. https://doi.org/10.3390/d12090322.

Effendi, H., 2003. Water quality assessment for management of aquatic resources and environment. Yogyakarta: Kanisius,

Gobeze, A., Kaba, T., Tefera, M., Lijalem, T., Legesse, M., Engdaw, F., Mulu, M., Wubet, W., Adugna, A., Guadie, A. 2023. Evaluation of water quality of Angereb reservoir: a chemometrics Approach. Applied Water Science. (13), 103. https://doi.org/10. 1007/ s13 201-023-01909-2.

Government Regulation (Republic of Indonesia). No. 22. Concerning the Implementation of Environmental Protection and Management, 2021.

Huang, Y.F., Ang, S.Y., Lee, K.M., Lee, T.S. 2015. Quality of water resources in Malaysia. Research and Practices in Water Quality, edited by Lee, T.S. Intech Open. 2015; Pp. 65-90.

Ishaq, F., Khan. 2013. Aquatic biodiversity as an ecological indicator for water quality criteria of river Yamuna in Doon Valley, Uttarakhand, India. World J Fish Mar Sci. 5:322–334.

Klippel, G., Macêdo, R.l., Branco, C.W.C. 2020. Comparison of different trophic state indices applied to tropical reservoirs. Lakes Reservoir. 25: Pp. 214–229.https://doi.org/10.1111/lre. 12320.

Kumar, M.P., Prabhahar, C. 2012. Physico-chemical parameters of river water: a review. Int J Pharm Biol Arch. 3:Pp. 1304–1312.

Lisa, K., Elis, I., Baskoro, R. 2023. The relationship between sea water height and electrical conductivity at the mouth of the Ketiwon River, Tegal. Indon esia n Journal of Oceanography. 5 (4): Pp. 239 – 248.

Mihir, P., Nihar, R.S., Pankaj, K.R., Malabika, B.R., 2015. Electrical Conductivity of Lake Water as Environ mental Monitoring – A Case Study of Rudrasagar Lake. IOSR Journal of Environmental Science. Toxicology and Food Technology. 9(3): Pp. 61-71. DOI: 10.9790/2402-09316671

Noori, R., Berndtsson, R., Franklin, A., Jan, R.A., Maryam., 2018. Temporal and depth variation of water quality due to thermal stratification in Karkheh Reservoir, Iran. Journal of Hydrology: Regional Studies. (19): Pp. 279–286. https://doi.org/10.1016/j.ejrh.2018.10.003.

Novotony, V., Olem, H., 1994. Water Quality Prevention, Identification and Manag ement of Diffuse Pollution. Van Nostr and Reinhold, New York. Pp. 18-25.

Odum, E.P., 1996. Fundamentals of Ecology. Third Edition Saunders College Publis hing. Rinehart and Winston. Pp. 486 .

Prabhakaran, K., Nagarajan, R., Franco, M.F., Anand, K.A., 2017. Biomo nitoring of Malaysian aquatic enviro nments: A review of status and prospects. Ecohydrology and Hydro biology. 17(2): Pp. 134-147. https:// doi.org/10.1016/j.ecohyd.2017.03.001.

Rocha, F.C., Andrade, E.M., Lopes, F.B., 2015. Water quality index calculated from biological, physical and chemical attributes. Environmental Monitoring and Assessment. 187(1): Pp.1-15. https://doi.org/10.1007/s10661-014-4163-1.

Schleiss, A.J., Franca, M.J., Juez, C., De Cesare, G., 2016. Reservoir sedime ntation. Journal of Hydraulic Research. 54 (6): Pp. 595-614.

Shaleh, F.R., Soewardi, K., Hariyadi, S. 2014. Water Quality and Trophic Status in Sempor Reservoir, Kebumen. Indo nesian Journal of Agricultural Sciences. 19 (3): Pp. 169-173.

Shangguan, Q., Lai, C.Z., Beatty, C.M., Young, F.L., Spaulding, R.S., Degrandpre, M.D. 2021. Autonomous in situ measurements of freshwater alkalinity. Limnology and Oceanogra phy: Methods Volume 19, Pp. 51-157. https://doi.org/10.1002/lom3.10404.

Sivaranjani, Rakshit, A., Singh, S. 2015. Water Quality Assessment with Water Quality Indices. International Journal of Bioresource Science. 2 (2): Pp. 85-94.

Sutela, T., Vehanen, T., Jounela, P., 2010. Response of fish assemblages to water quality in boreal rivers. Hydrobiologia. 641: Pp. 1-10. https://doi.org/ 10.1007/ s10750-009-0048-7.

Tas, B., 2012. Diversity of phytoplankton and trophic status in the Gaga Lake, Turkey. EES Technology Part A: Energy Science and Research. 30(1): Pp. 33-44.

Ummenhofer, C.C., Meehl, G.A., 2017. Extreme weather and climate events with ecological relevance: A review. Philosophical Transactions of the Royal Society B. 372(1723), 20,160, Pp. 135–20,160,113. https://doi.org/ 10.1098/ rstb.2016.0135.

Utomo, A.D. 2013. Estimation of carrying capacity for fish culture of floating net cages at Gajah Mungkur Reservoir. Ph.D. Thesis, Sriwijaya University, Palembang, Indonesia. [In Indonesian].

Utomo, A.D., Wibowo, A., Suhaimi, R., Atminarso, D., Baumgartner, L.J. 2019. Challenges balancing fisheries resource management and river development in Indonesia. Marine and Freshwater Research. 70:1265-1273.https://doi.org/10. 1071/mf19160.

Wetzel, R.G., 2001. Limnology: Lake and River Ecosystems. Third Edition, Academic Press, San Diego, 1006.

Wiegand, M.C., Nascimento, A.T.P., Costa, A.C., Neto, I.E.L., Eduardo, I. 2021. Trophic state changes of semi-arid reservoirs as a Function of The Hydro-Climatic Variability. Journal of Arid Environments. 184.104321. https://doi.org/10.1016/j.jaridenv.2020.104321.

Williams, W.D., Mann, K.H. Inland Water Ecosystem. 28 July 2024. https:// www.britannica.com/science/inland-water-ecosystem.

Woldeab, B., Ambelu, A., Efrem, Z., Deribe, S., Megersa, M., Alemu, T., Mereta, S.T. 2023. Depth profile of reservoir water quality in the Southwest of Ethiopia. Heliyon. 9 e17474. https://doi.org/ 10.1016/ j.heliyon.2023.e17474.

World Health Organization (WHO). 2017. Guidelines for drinking water quality: fourth edition incorp orating the first Addendum. World Health Organization, Geneva.

Xiao, M., Bao, F., Wang, S., Cui, F. 2016. Water quality and protection: Water-quality assessment of the Huaihe River segment of Bengbu (China) using multivariate statistical techniques. Water Resources. 43(1): Pp. 166-176. https://doi.org/10.1134/s00978078 16010115.

Yin, Z., Duan, R., Li, P., Li,W. 2021. Water quality characteristics and health risk assessment of main water supply reservoirs in Taizhou City, East China. Human and Ecological Risk Assessment: An International Journal. (27): Pp. 2142-2160. https://doi.org/10.1080/10807039.2021.1958670.

Zakeyuddin, M.S., Sah, A.S.R.M., Moha mmad, M.S., Fadzil, N.F.M., Hashim, Z.H., Omar, W.M.W., 2016. Spatial and Temporal Variations of Water Quality and Trophic Status in Bukit Merah Reservoir, Perak. Sains Malaysiana. 45(6): Pp. 853–863.

Pages 487-494
Year 2024
Issue 4
Volume 8

Download

Water Conservation and Management (WCM)

wcm.04.2024.480.486

ENVIRONMENTAL IMPACT OF WASTEWATER TREATMENT PLANT USING LIFE-CYCLE ASSESSMENT– CASE STUDY IN JORDAN

Journal: Water Conservation and Management (WCM)
Shorouq Bani Ata, Ahmad Jamrah, Tharaa M. Al -Zghoul
Print ISSN : 2523-5664
Online ISSN : 2523-5672

This is an open access article distributed under the Creative Commons Attribution License CC BY 4.0, which permits unrestricted use, distribution, and reproduction in any medium, provided the original work is properly cited

Doi: 10.26480/wcm.04.2024.480.486

Abstract

Al-Samra Wastewater Treatment Plants (WWTPs) play a vital role in Jordan in treating wastewater to preserve the ecosystem and public health. A life cycle assessment (LCA) approach is employed to assess the ecological impact of Al-Samra WWTP through the years 2021 and 2022. This research aims to employ LCA for the Al-Samra operational phase and quantify the key potential environmental impacts associated with its operation and Gate-to-Grave boundary using the OpenLCA software tool and the Recipe 2016 midpoint (H) method. The LCA results reveal that the Al-Samra WWTP in 2021 had the most significant impact when compared to the year 2022 in categories of global warming, ionizing radiation, land use, ozone formation-human health, ozone formation-terrestrial ecosystems, and stratospheric ozone depletion, while in 2022 Al-Samra WWTP had the highest impact assessment results compared to the year 2021 in other categories like fine particulate matter formation, fossil resource scarcity, mineral resource scarcity, terrestrial acidification, and water consumption. The main contributors to environmental impact are inlet load and flow in the operation phase, which relies on electricity as the energy source and contributes significantly to the overall environmental impact. Based on these potential results, the research highlights the importance of implementing sustainable practices to reduce the ecological effects of WWTPs.

Keywords

Life cycle assessment (LCA), wastewater treatment plants (WWTPs), Al-Samra wastewater treatment plant, case study, openLCA.

1. INTRODUCTION

Countries worldwide are experiencing increasing global water stress due to a lack of water supply and deteriorating quality because of the exponential increase in the world’s population, industrialization, and agricultural activities (Kamble et al., 2018; Al-Zghoul et al., 2023). Therefore, taking the proper actions, such as treating wastewater produced by daily activity and reusing it, will aid in resolving the issues of water scarcity and declining river and ocean water quality (Jabr et al., 2019; Jamrah et al., 2023). Wastewater treatment plants (WWTPs) are designed to reduce the amount of contaminants in wastewater before it is released into the environment (Gallego-Schmid and Tarpani, 2019; Allami et al., 2023). One significant issue in emerging nations is the need for more WWTPs. However, WWTPs are one of the primary sources of greenhouse gases (GHGs) emissions, which helps increase global warming by releasing CO2, N2O, and CH4 into the atmosphere (Nguyen et al., 2019; Gallego-Schmid and Tarpani, 2019). According to estimates, 5% of the world’s GHGs emissions come from WWTPs (Nghiem et al., 2017).

Jordan, as one of the poorest countries in the world in terms of availability of fresh water, faces great challenges in preserving groundwater sources from excessive depletion, and ensuring a fair distribution of water between different sectors (Hamaideh et al., 2024). With apparent effects on cities, businesses, social systems, agriculture, and food security, it is becoming more vulnerable to climate change (Gallego-Schmid and Tarpani, 2019). Even though Jordan’s GHGs emissions are relatively low globally, it is one of the countries where the effects of climate change are starting to be seen (Ministry of Environment, 2022). Due to the severe water scarcity that Jordan suffers from, it has become necessary to adopt a sustainable management approach to these limited resources to address these challenges (Nguyen et al., 2019; Alazaiza et al., 2024). This requires taking comprehensive measures at the policy and legislative levels, investing in water harvesting, treatment and recycling technologies, and enhancing community awareness of the importance of rationalizing water consumption. It became Jordan’s environmental protection law requiring facilities to conduct an environmental impact assessment (EIA) study to identify environmental gaps and work to improve them (Ministry of Environment, 2022).

Before constructing WWTPs and to ensure that they comply with a certain design and operation that will not hurt the environment, studies like life cycle assessment (LCA) are essential. LCA examines how an item or system affects the environment and quantifies the possible lifetime impacts of WWTPs during its extraction, manufacture, distribution, use, and disposal of raw materials (Curan, 2005). The LCA method entails identifying and analyzing various environmental impacts, including using primary resources, GHGs emissions, waste production, depletion of resources, and pollution of the air, water, and soil (Curan, 2005). While WWTPs provide direct environmental benefits, but they also have negative impacts because of their high energy requirements for operating the treatment facilities and infrastructure (Rashid et al., 2023). When evaluating WWTPs, it is important to consider not just the environmental impacts, but also compliance with the technology costs and regulatory requirements involved (Rashid et al., 2023). Other key factors include the regional/global environmental impacts, socioeconomic conditions, and location (Rashid et al., 2023). To assess these various factors, LCA tools are frequently used, with software options such as Umberto, Gabi, OpenLCA, Semipro, and others (Iswara et al., 2020). These LCA approaches provide a more comprehensive analysis to inform decision-making around WWTPs.

One well-known and user-friendly software program that enables LCA is OpenLCA (Kiemel et al., 2022; Allami et al., 2023). A key advantage of OpenLCA is that it allows users to work with a variety of LCA databases, which experts endorse for the software’s usability and the breadth of its underlying data (Delre et al., 2019). The application of LCA methodology can be particularly valuable in the optimization of operational parameters for WWTPs. By evaluating the full life cycle impacts, LCA can help WWTPs meet the requirements outlined in the ISO 14040 standard and inform optimal decision-making (Aleisa and Al-Mutiri, 2022). This holistic approach ensures that all relevant environmental impacts, such as GHGs emissions, energy use, and material inputs and outputs, are quantified and compared across different WWTP configurations (Kyung et al., 2015; Larrey-Lassalle et al., 2017). Overall, the LCA framework facilitated by tools like OpenLCA enables a thorough and systematic evaluation of the environmental performance of complex systems like WWTPs. This information can then be leveraged to drive continuous improvement and more sustainable outcomes.

Research in the wastewater sector using the LCA approach is limited worldwide; in the Middle East, it is minimal, and in Jordan, for example, LCA is not a legal requirement in EIA. Many countries, especially in the Middle East, may need more funding, technical capabilities, and access to accurate data, which can hinder the adoption. The Research will contribute to increasing the global adoption of the LCA approach in WWTP projects, including those in the Middle East, raising the bar for sustainability in environmental assessment procedures and directing improvements and ideas for ecological management. However, despite the significant influence LCA can have on decision-making related to sustainable development goals (SDGs) and environmental conservation, the application of LCA to full-scale WWTPs operational and design alternatives remains limited. WWTPs can be designed based on a variety of social, economic, and technical factors, and these design choices can greatly impact the potential strategies for performance improvement. This research presents a case study from Jordan to serve as a model for environmental impact studies that employ the life cycle approach for other WWTPs and how to quantify and analyse the contribution. The goal of this study was to conduct an LCA using the OpenLCA software for Al-Samra WWTP’s as a case study by finding potential environmental impacts. Finding Al-Samra WWTP’s potential environmental impacts utilizing LCA for the operational phase can provide a baseline reference for the Samra Plant’s ecological performance to make it possible to compare it later with any potential environmental benefits or drawbacks during the operational and demolition phases.

2. MATERIALS AND METHODS

2.1 The Case-Study WWTP

One of Jordan’s largest wastewater treatment facilities in terms of size is the Al-Samra WWTP, so it selection as a case study and its utilization of cutting-edge technology to guarantee the most excellent purification rates (Jabr et al., 2019). Al-Samra WWTP is in Jordan, inside the Al Hashimiya area in the governorate of Al-Zarqa, thirteen kilometers north of Zarqa and thirty-six kilometers, roughly to the Capital of Jordan, Amman. AL-Samra WWTP is designed to treat domestic wastewater discharged from the Zarqa river basin, including the three most populous cities in the nation: Amman, Russeifa, and Zarqa. Additionally, the facility generates treated water that can be used for irrigation, essential for sustaining agricultural activity in the area (Abu-Shams and Rabadi, 2003). Figure 1 illustrates the study area’s location.

The building of the Al-Samra plant was completed in 2008. Al-Samra WWTP is a public-private partnership (PPP) that uses the build-operate-transfer (BOT) approach to finance the construction and upkeep of a public project. It is essential to Jordan’s social, environmental, and economic growth because it is the country’s first BOT project (Abu-Shams and Rabadi, 2003). Under the same BOT concept as in 2010, the Al-Samra plant’s capacity will be enhanced by approximately 40% to accommodate growing wastewater flows predicted in the Amman and Zarqa areas for the horizon of 2025. Now, the project involves expanding the Al-Samra WWTP, which will be based on the same process. This will involve building the operations and adding structures and machinery that the plant now utilizes (Hanjra et al., 2015).

2.2 Goal and Scope Definition

The first stage of the LCA analysis establishes the goal and scope of the assessment. LCA was implemented to find the potential environmental impacts of the Al-Samra WWTP operational phase based on the data for the years 2021 and 2022. About the scope, Samra WWTP was divided into three subsystems as follows: Sub1, “preliminary and primary treatment,” Sub2, “secondary and tertiary treatment,” and Sub3, “sludge treatment.”

2.3 Functional Unit (FU)

The FU gives a reference point from which the process inputs and outputs can be standardized (Zhu et al., 2013). The FU here is the flow rate. At the WWTP inflow point, it is defined as one cubic meter of wastewater.

2.4 System Boundary

The defining of the system border plays a vital role in determining which processes will be included in the system or excluded from it. Gate-to-Grave approach was adopted. Figure 2 shows the system boundary designed to apply the LCA Study for Al-Samra WWTP, considering the subsystems.

2.5 Life Cycle Inventory (LCI)

This step involves gathering and defining a system’s inputs and outputs. An inventory analysis analyzes the energy and resources used and the environmental emissions related to every process in the system (Guinée et al., 2011). The inventory data for Samra WWTP for 2021 and 2022 inputs was collected primarily from MWI and Samra WWTP reports. In addition, the possible outputs were taken from OpenLCA software databases. The primary resources used in a WWTP process are shown in Table 1.

2.6 Life Cycle Impact Assessment (LCIA)

The third stage of an LCA is the life cycle impact assessment (LCIA). To better comprehend the extent and significance of the outcome, elementary flows from the LCI study are transformed here into their possible impact on the environment. Category impact, classification, and characterization are required phases in an LCIA, according to the ISO 14040 series. Several methods, including CML 2001, cumulative energy demand, Eco indicator 99, ecological footprint, ecological scarcity 1997 and 2006, ecosystem damage potential (EDP), EPS 2000, IMP ACT 2002+, IPCC 2001, Recipe midpoint and endpoint approach, TRACI, and USEtox, have been developed by environmental research centres to calculate the results of impact assessments.

2.7 Recipe 2016 Midpoint Method

Recipe 2016 Midpoint is the impact assessment method used in this research per the objective to find the potential environmental impact according to the inventory data for Al-Samra WWTP in years 2021 and 2022, such as global warming, ionizing radiation, land use, ozone formation-human health, ozone formation-terrestrial ecosystems, and stratospheric ozone depletion, fine particulate matter formation, fossil resource scarcity, mineral resource scarcity, terrestrial acidification, and water consumption. For carrying out life cycle evaluations and applying the Recipe method, openLCA 2.0 is a popular software program.

2.8 OpenLCA 2.0.0 Modelling Tool

The tool used in this research is OpenLCA 2.0.0 software with the Recipe 2016 midpoint (H) method that aimed to understand the potential environmental effects of the Al-Samra WWTP process in 2021 and 2022. OpenLCA is free software for LCA and sustainability evaluation. Since 2006, Green Delta has been working on its development (Ciroth, 2007). It is free to use and requires no license because it is open-source software.

The software is excellent for use with sensitive data due to its open-source nature. The software has the following components: product systems are networks of processes, product systems are compared in projects; processes are a set of interconnected activities that convert inputs into outputs; flows are the movement of goods, materials, or energy throughout a product system’s many processes; the indicators and parameters are LCIA techniques for environmental impact assessment. Global parameters apply to the entire database and social LCA indicators. The background information includes flow characteristics, unit types, currencies, sources, actors, and locations (Ciroth, 2007).

2.9 Interpretation

Interpretation presents inferences from the data, such as the critical effect causes and potential mitigation strategies (Ahmed, 2011). Inventory analysis outcomes are assessed. The last step in the LCA approach checks sensitivity analysis; it is possible to evaluate the effect of uncertainty on the outcomes of an LCA by utilizing Monte Carlo simulation in OpenLCA. It considers the uncertainty distributions defined in the parameters, fluxes, and characterization factors. The simulation, by selecting values at random from the specified uncertainty distributions based on the sampled distributions, produces several LCA computation iterations, each with a different set of input values.

3. RESULTS

3.1 Impact Analysis Results of Al-Samra WWTP

The ecological implications of the processes are measured during the impact analysis phase. Typically, this phase involves classification and characterization steps. In the classification step, the environmental effects are divided into groups according to their impact, such as water consumption, climate change, human toxicity, etc. The consequences are categorized according to their type and possible environmental effects. During the characterization step of each impact category, the environmental impacts are measured and expressed in a standard unit in this stage. This makes it simpler to compare and aggregate the effects across several categories. According to data inventory in 2021 and 2022, Samra WWTP impact assessment results for subsystems based on the Recipe 2016 midpoint, which finds the potential environmental impact according to 11 categories as presented in Tables 2 and 3 below.

As shown in Table 2, in 2021 subsystem 1 had the most significant impact in each of the following categories: fine particulate matter formation, fossil resource scarcity, global warming, ionizing radiation, land use, mineral resource scarcity, stratospheric ozone depletion, terrestrial acidification, and water consumption this is due to the primary treatment stage aims to remove suspended solids from the wastewater, and these solids can include organic matter, debris, and other pollutants also the diesel consumption to operate pumps and other equipment used in subsystem 1 led to a higher environmental impact where the primary stage requires the use of natural resources more than other stages in WWTP, such as water, land, and raw materials. Exploiting these resources unsustainably may lead to potential environmental impact and increased greenhouse gas emissions. Also, Table 2 shows that subsystem 2 significantly impacts the category’s ozone formation- human health and ozone formation-terrestrial ecosystems. It can come back to using some chemicals and electricity in subsystem 2, which can contribute to air pollution and negative impacts on health.

As shown in Table 3, in the year 2022, subsystem 1 has the most significant impact on all categories due to the flow rate in the year 2022 entering the Al-Samra WWTP being higher than the flowrate in the year 2021, and this led to the use of natural resources than other stages in WWTP, such as water, land, and raw materials. Exploiting these resources unsustainably may lead to potential environmental impact and increased greenhouse gas emissions.
Figure 3 shows the results for potential environmental impact according to data gathering in 2021. The maximum result sub1 and sub2 for each indicator is set to 100%, and the outcomes of the remaining options are presented in proportion to this result.

The results for potential environmental impact according to data gathering in 2022. The maximum result sub1 for each indicator is set to 100%, and the outcomes of the remaining options are presented in proportion to this result shown in Figure 4.

Further analysis showed that in 2021 Al-Samra WWTP had the most significant impact assessment results when compared to the year 2022. Al-Samra WWTP in 2021 had the most impact in categories of global warming, ionizing radiation, land use, ozone formation-human health, ozone formation-terrestrial ecosystems, and stratospheric ozone depletion as shown in Table 4. In addition, Al- Samra WWTP in 2022 had the highest impact assessment results compared to 2021 in other categories like fine particulate matter formation, fossil resource scarcity, mineral resource scarcity, terrestrial acidification, and water consumption as shown in Table 4.

3.2 Top Contributors to Impact Categories

In the impact assessment step in the life cycle. Finding hotspots is essential to comprehending the main places that might be improved to lessen environmental effects. This section comprehensively analyses the main contributors affecting Al-Samra WWTP in 2021 and 2022, as shown in Figure 5 to Figure 10.

According to Figures (5-10), the main contributors in subsystems during the 2021 and 2022 data inventory are as follows: Subsystem (1): Inflow WW Capacity, Subsystem (2): Electricity Consumption, and Subsystem (3): Inlet Load.

Increased energy use, chemical use, and sludge production are consequences of high inlet loads for WWTPs, and they all adversely affect the environment. As their content increases, more energy and resources are needed to remove pollutants and organic materials from the incoming load. Also, many operations, such as sludge treatment, mixing, aeration, and pumping, require electricity. There may be varying environmental effects depending on whether the energy used to generate electricity comes from renewable or fossil fuels.

The rate at which wastewater enters the treatment facility impacts efficiency and energy usage. Increased energy use for pumping and aeration procedures at higher flow rates results in higher electricity consumption. Moreover, excessive flow rates can overwhelm the treatment systems, decreasing efficiency and posing environmental contamination risks.

4. CONCLUSIONS AND RECOMMENDATIONS

In conclusion, this research has achieved its goal of conducting LCA on Al-Samra WWTP located in Jordan for the operational phase through the years 2021 and 2022 and solved the challenge of measuring impacts by quantifying its potential environmental effects using the OpenLCA software tool and the Recipe 2016 midpoint H method.

Impact analysis results showed that the Al-Samra WWTP in 2021 had the most significant impact assessment results when compared to the year 2022 in categories of global warming, ionizing radiation, land use, ozone formation-human health, ozone formation-terrestrial ecosystems, and stratospheric ozone depletion. In addition, Al-Samra WWTP in 2022 had the highest impact assessment results compared to 2021 in other categories like fine particulate matter formation, fossil resource scarcity, mineral resource scarcity, terrestrial acidification, and water consumption.

Among the primary flows, the inlet flow (m3/year), electricity consumption (kwh/year), and inlet load (kg/year) are the main contributors to environmental impact for the Al-Samra operational phase in the years 2021 and 2022.

In summary, this research offers insightful information into the potential environmental impact of Al-Samra WWTP in Jordan. The findings highlight the necessity of conducting an environmental assessment using the life cycle to comprehend the environmental impact and develop additional strategies to adapt or mitigate their environmental impact in sustainable ways.

RECOMMENDATIONS

The following recommendations highlight essential factors to consider for ensuring comprehensive LCA, supporting informed decision-making, and implementing sustainable management practices for WWTP. These recommendations are based on the detailed analysis carried out in this research. Following are a few recommendations for future works based on the current research:

• It is highly recommended to conduct an environmental impact assessment using the life cycle for WWTPs during the following phases: construction, operation, and demolition, but the need to focus on stages of the system boundary selected for the study and the LCI gathered because the correctness of the results utilizing LCA depends on them.

• LCA is an iterative process. Use the results from the LCA to drive sustainable changes and put a mitigation plan. LCA is not legally required in most countries like EIA studies, but we find that LCA results can aid compliance with environmental norms and regulations. Stakeholder participation is also encouraged at every stage of the life cycle.

• Conducting an energy audit in the WWTP to locate potential savings opportunities and considering renewable energy sources like solar to minimize the plant’s ecological footprint.

• Increase the use of treated wastewater inside WWTP for non-potable purposes like the irrigation of fields, recreational areas, and green spaces. Implement a comprehensive water reuse program to lessen the demand for freshwater resources and ease the strain on water supplies.

• Additional research may yield valuable perspectives regarding the possible benefits of centralized and decentralized systems concerning energy usage, emissions, and resource retrieval.

• The LCA approach does not always consider human behaviours, and there are numerous methods to slice data and information to achieve the intended result; we still need to improve it and further research.

• Further, based on the results of this research. Add social and economic aspects to the WWTP LCA framework. This may entail evaluating various technologies and operational approaches for societal acceptability, economic viability, and cost-effectiveness.

REFERENCES

Abu-Shams, I., and Rabadi, A., 2003. Commercialization and public-private partnership in Jordan. International Journal of Water Resources Development, 19(2), Pp. 159-172.

Ahmed, M. T., 2011. Life cycle analysis in wastewater: a sustainability perspective. Waste water treatment and reuse in the mediterranean region, Pp. 125-154.

Alazaiza, M. Y., Alzghoul, T. M., Al Maskari, T., Amr, S. A., and Nassani, D. E., 2024. Analyzing the Evolution of Research on Student Awareness of Solid Waste Management in Higher Education Institutions: A Bibliometric Perspective. Sustainability, 16(13), Pp. 5422.

Aleisa, E., and Al-Mutiri, A., 2022. Life Cycle Assessment for Tertiary Wastewater Treatment and Reuse versus Seawater Desalination. In IOP Conference Series: Earth and Environmental Science, Vol. 1026, No. 1, Pp. 012001. IOP Publishing.

Allami, D. M., Sorour, M. T., Moustafa, M., Elreedy, A., and Fayed, M., 2023. Life cycle assessment of a domestic wastewater treatment plant simulated with alternative operational designs. Sustainability, 15(11), Pp. 9033.

Allami, D. M., Sorour, M. T., Moustafa, M., Elreedy, A., and Fayed, M., 2023. Life cycle assessment of a domestic wastewater treatment plant simulated with alternative operational designs. Sustainability, 15(11), Pp. 9033.

Al-Zghoul, T.M., Al-Qodah, Z., and Al-Jamrah, A., 2023. Performance, modeling, and cost analysis of chemical coagulation-assisted solar powered electrocoagulation treatment system for pharmaceutical wastewater. Water, 15(5), Pp. 980.

Ciroth, A., 2007. ICT for environment in life cycle applications openLCA—A new open source software for life cycle assessment. The international journal of life cycle assessment, 12, Pp. 209-210.

Curan, M. A., 2005. What is the LCA? United States Environmental Protection Agency, National Risk Management Research Laboratory.

Delre, A., ten Hoeve, M., and Scheutz, C., 2019. Site-specific carbon footprints of Scandinavian wastewater treatment plants, using the life cycle assessment approach. Journal of cleaner production, 211, Pp. 1001-1014.

Gallego-Schmid, A., and Tarpani, R.R.Z., 2019. Life cycle assessment of wastewater treatment in developing countries: a review. Water research, 153, Pp. 63-79.

Guinée, J. B., Heijungs, R., Huppes, G., Zamagni, A., Masoni, P., Buonamici, R., Rydberg, T., 2011. Life cycle assessment: past, present, and future.

Hamaideh, A., Al-Zghoul, T., Dababseh, N., and Jamrah, A., 2024. Enhancing Water Management in Jordan: A Fresh Tomato Water Footprint Analysis. Jordan Journal of Agricultural Sciences.

Hanjra, M. A., Drechsel, P., Mateo-Sagasta, J., Otoo, M., and Hernández-Sancho, F., 2015. Assessing the finance and economics of resource recovery and reuse solutions across scales. Wastewater: Economic asset in an urbanizing world, Pp. 113-136.

Iswara, A. P., Farahdiba, A. U., Nadhifatin, E. N., Pirade, F., Andhikaputra, G., Muflihah, I., and Boedisantoso, R., 2020. A comparative study of life cycle impact assessment using different software programs. In IOP conference series: earth and environmental science, Vol. 506, No. 1, Pp. 012002. IOP Publishing.

Jabr, G., Saidan, M., and Al-Hmoud, N., 2019. Phosphorus recovery by struvite formation from Al Samra municipal wastewater treatment plant in Jordan. Desalination and Water Treatment, 146, Pp. 315-325.

Jamrah, A., Al-Zghoul, T.M., and Darwish, M.M., 2023. A comprehensive review of combined processes for olive mill wastewater treatments. Case Studies in Chemical and Environmental Engineering, 100493.

Kamble, S.J., Singh, A., and Kharat, M.G., 2018. Life cycle analysis and sustainability assessment of advanced wastewater treatment technologies. World Journal of Science, Technology and Sustainable Development, 15(2), Pp. 169–185.

Kiemel, S., Rietdorf, C., Schutzbach, M., and Miehe, R., 2022. How to Simplify Life Cycle Assessment for Industrial Applications—A Comprehensive Review. Sustainability 2022, 14, Pp. 15704.

Kyung, D., Kim, M., Chang, J., and Lee, W., 2015. Estimation of greenhouse gas emissions from a hybrid wastewater treatment plant. Journal of Cleaner Production, 95, Pp. 117-123.

Larrey-Lassalle, P., Catel, L., Roux, P., Rosenbaum, R. K., Lopez-Ferber, M., Junqua, G., and Loiseau, E., 2017. An innovative implementation of LCA within the EIA procedure: Lessons learned from two Wastewater Treatment Plant case studies. Environmental Impact Assessment Review, 63, Pp. 95-106.

Ministry of Environment (MOENV). 2022. National climate change policy of the Hashemite Kingdom of Jordan 2022-2050.
Nghiem, L. D., Koch, K., Bolzonella, D., and Drewes, J. E., 2017. Full scale co-digestion of wastewater sludge and food waste: Bottlenecks and possibilities. Renewable and Sustainable Energy Reviews, 72, Pp. 354-362.

Nguyen, T.K.L., Ngo, H.H., Guo, W., Chang, S.W., Nguyen, D.D., Nghiem, L.D., Liu, Y., Ni, B., and Hai, F.I., 2019. Insight into greenhouse gases emissions from the two popular treatment technologies in municipal wastewater treatment processes. Science of the Total Environment, 671, Pp. 1302-1313.‏

Rashid, S. S., Harun, S. N., Hanafiah, M. M., Razman, K. K., Liu, Y. Q., and Tholibon, D. A., 2023. Life cycle assessment and its application in wastewater treatment: a brief overview. Processes, 11(1), Pp. 208.

Zhu, L., Liu, B., Wang, F., and Bi, J., 2013. Raising discharge standards leads to environmental problem shifting in China. Water science and technology, 68(12), Pp. 2605-2612.‏

Pages 480-486
Year 2024
Issue 4
Volume 8

Download