wcm.04.2024.475.479
GROUNDWATER QUALITY MAPPING BASED ON GEOSPATIAL ANALYSIS OF QUALITY STANDARD WITH GEOLOGICAL REVIEW IN SOUTH COASTAL JEMBER
Journal: Water Conservation and Management (WCM)
Muammar Kadavi, Yushardi, Ana Susiati, Sri Astutik, Muhammad Asyroful Mujib, Bejo Apriyanto
Print ISSN : 2523-5664
Online ISSN : 2523-5672
This is an open access article distributed under the Creative Commons Attribution License CC BY 4.0, which permits unrestricted use, distribution, and reproduction in any medium, provided the original work is properly cited
Doi: 10.26480/wcm.04.2024.475.479
Abstract
 Observation results on the south coast of Jember show that there are differences in the characteristics of groundwater in several residents’ dug wells, namely some are fresh and brackish. Based on the findings of these problems, the aim of this research is to analyze and map soil quality based on quality standards with geological observations on the south coast of Jember. This research uses quantitative methods through surveys to determine the quality of groundwater used for drinking water in the Jember South Coastal Area with the parameters tested including TDS, odor, taste, pH, sulfate, chloride and hardness. The results of groundwater quality on the southern coast of Jember Regency show that based on the test results of physical parameters and chemical parameters, most of the air samples are of drinking quality. The results of groundwater quality mapping with geological observations based on the Jember geological map sheet show that 47 km2 (17,8%) of non-drinkable areas are located on alluvial plains interspersed with puger formations in the form of limestone which has high porosity and permeability and 227 km2 (82,2%) the potable area is located in geological interbeds of sandstone and clay with low porosity and permeability.
Keywords
Mapping, Groundwater Quality, South Coast of Jember
1. INTRODUCTION
Groundwater is a medium that can change and absorb substances from every rock it passes through. In addition, it is an important part of the survival of humans and living things around it (Fetter, 2014). The nature of groundwater dissolves minerals from the rocks it passes through (Arivoli et al., 2018). Therefore, the mineral content of an aquifer is strongly influenced by the type of rock it passes through, or the type of groundwater based on the chemical elements contained therein (Singhal, and Gupta, 2010). Groundwater quality can also be affected by proximity to the sea. Locations closer to the sea tend to have more brackish or salty groundwater. Groundwater in coastal areas, which is generally brackish, has a relatively high electrical conductivity value and a salty taste (Febriarta, 2020). Groundwater that has electrical conductivity can also be supported by the physical properties of rocks in the form of resistance types (Susiati et al., 2024). The composition of groundwater can be seen, among others, through the use of physical parameters in the form of TDS so that the total solute content can be known (Indartin and Mujib, 2020).
Groundwater in coastal areas can vary, and this is influenced by various factors, including distance to the sea, groundwater depth, rock porosity, and overlying human activities (Purnama, 2010). According to Hounsinou 2020, changing groundwater dynamics are also influenced by the season, as seawater intrusion is more likely to occur in the dry season than in the rainy season (Hounsinou, 2020). Seawater intrusion occurs when seawater enters fresh groundwater aquifers due to seawater pressure or thrust, this can occur due to empty freshwater aquifer cavities. Aquifers that consist of impermeable rocks or consist of saline layers underground can cause groundwater to become saline (Dhal and Swain, 2022). Rock conditions with rock lithology characteristics in the form of porosity and permeability greatly affect groundwater conditions through absorption (Pratiwi et al., 2022).
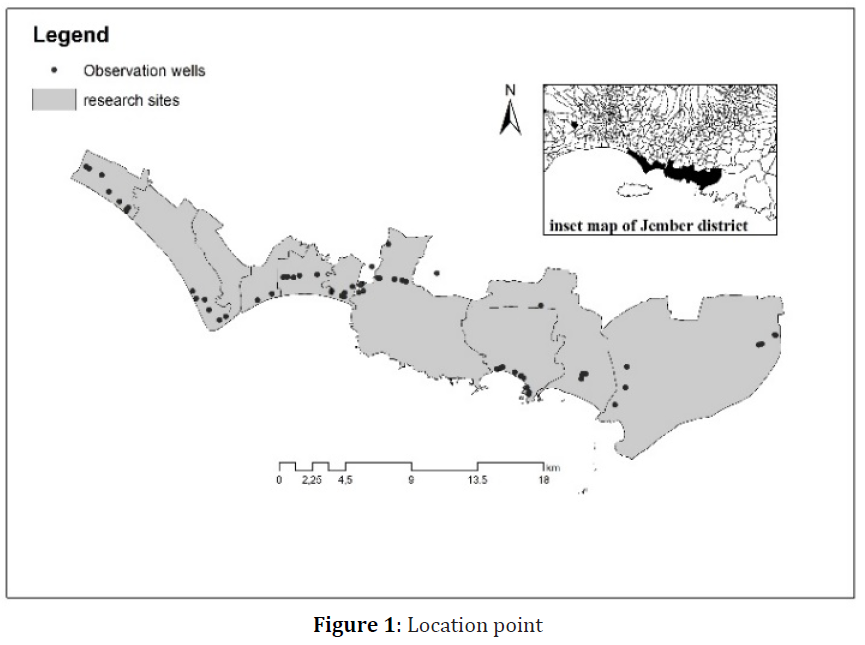
The phenomenon of seawater intrusion and the complex geological characteristics of the region can cause differences in groundwater quality between fresh and brackish groundwater (Damayanti et al., 2020) [11]. On the south coast of Jember Regency, the study area covers ten villages with an area of approximately 1244 km2, including Paseban, Kepanjen, Mayangan, Mojomulyo, Mojosari, Puger Kulon, Lojejer, Sabrang, Sumberejo, and Curah Nongko villages. Geologically, based on the geological map of the Jember sheet, the research area is composed of three main rock formations, namely from the youngest of which are alluvial deposits, the Puger Formation, and the Batu Ampar Formation with rock lithology dominated by sandstone and limestone. The Puger and Batu Ampar formations consist of rocks with high porosity and permeability, such geological conditions are considered to encourage seawater intrusion. Based on observations, there are findings of differences in groundwater characteristics in one of the residents’ dug wells, namely in Sabrang Village with fresh characteristics with a well depth of 4.5 and in Sumberejo Village with brackish characteristics at a well depth of 4 meters. It is also known that residents there are very dependent on the existence of groundwater for their daily needs. Based on these findings, it is necessary to conduct research on groundwater quality mapping for drinking water considering the importance of groundwater quality information in order to meet life needs, water use patterns, and water being a basic need.
Based on previous research, a similar study was conducted by Sutrisno 2022, namely in residential areas in the coastal area of Pancer Beach, Puger Kulon Village, Jember (Sutrisno et al., 2022). The purpose of this research is to see the distribution of water quality due to seawater intrusion in residential areas around Pancer Beach. Some of the things done in this study are measuring pH, TDS, color, taste, and odor of water in settlements around Pancer Beach. The results showed that seawater intrusion occurred in the settlements around Pancer Beach, this is evidenced by the pH and TDS values which are below the water quality standards.
Another study was conducted by Apriansyah, The purpose of this study was to provide an overview of groundwater quality in the coastal area of Majene Regency, with particular emphasis on hardness, dissolved oxygen (DO) levels, and salinity levels. The results show that seawater intrusion and geological conditions affect water quality in the coastal area of Majene Regency. The hardness analysis showed that Banggae Timur sub-district has the highest level of hardness at 1509.2 ppm, which is caused by the type of soil and limestone present there. In addition, salinity analysis found that East Banggae sub-district has the highest salinity of 3.6‰, which is caused by the sloping contour of the land, which allows for seawater intrusion (Yusman et al., 2019).
Compared to some previous studies, there are still not many previous studies that focus on mapping and analyzing groundwater quality for drinking water and reviewing the condition of the rock formation. This research uses parameter tests including physical parameters including TDS, odor, and taste, and chemical parameters including pH, sulfate, chloride, and hardness. The research location was chosen with the urgency of considering the feasibility of groundwater quality for drinking water. The purpose of this study is to assess and map the quality of groundwater based on standard standards with geological reviews on the south coast of Jember.
2. METHODOLOGY
This study used a quantitative method through a survey to determine the quality of groundwater used for drinking water in the South Coastal Area of Jember. This study used descriptive analysis to describe the data collection of field test results. Furthermore, water quality was measured by measuring indicators of research parameters. This research was conducted using the survey method as a primary data source from water samples in the South Coastal Area of Jember Regency.
2.1 Research sample
The research area is located in the southern coastal area of Jember Regency which administratively includes 10 villages namely Paseban, Kepanjen, Mayangan, Mojomulyo, Mojosari, Puger Kulon, Lojejer, Sabrang, Sumberejo, and Curahnongko. This research uses quantitative methods through surveys to determine the quality of groundwater used for drinking water in the South Coastal Area of Jember. As for the determination of water sampling location points using purposive sampling method with consideration that the location represents geological formations and is in the coastal area with a radius of less than 8 km from the coastline inland. The total samples taken for the determination of water quality at the research site were 66 water samples for the test of physical parameters (TDS, odor, and taste), then from the 66 water samples, 11 water samples were taken with the criteria for the highest TDS value in each sample representing each village for the purpose of testing chemical parameters (pH, Sulfate, Chloride, and Hardness). Data collection techniques used in this research are field survey and documentation.
2.2 Data analysis
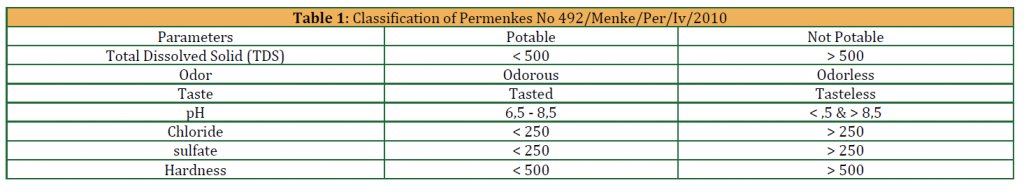
Data analysis techniques on the determination of drinking water quality using drinking water quality standards Permenkes No 492/Menke/Per/Iv/2010 to explain the value of groundwater quality findings and its feasibility for drinking water. Related to the findings of groundwater quality, the results of soil quality measurements will then be analyzed and classified into two categories, namely feasible or not feasible for drinking as in Table 1.
The mapping analysis was analyzed using the Kriging Interpolation method, namely ordinary kriging with consideration of the advantages of being able to produce estimates of values at unmeasured locations by considering their distance from known data points, so as to provide a good representation for areas not covered by measurement data. The ordinary kriging method, also known as linear kriging, involves using a weighted linear combination of available data to estimate values at unsampled points (Isaaks et al., 1989). This method assumes that the regional variable 𝑍 𝑥 is stationary, with unknown and constant mean values. To estimate the value at point 𝑥0, ordinary kriging uses a linear combination of the random variable 𝑍 𝑥𝑖 and the kriging weight 𝜆𝑖, which can be expressed mathematically as follows:
Z(s0) = ∑_(0=1)^N▒λi Z(si)
Description:
Z(s0) : Interpolated value of two locations s0
Z(si) : Measured value at location si (i = 1, 2,…N).
Λi : Kriging weights determined based on the distance and spatial distribution of the data.
N : Number of measured points used in the interpolation.
The analysis of the Geology review is measured using the rock type method in the form of a review of permeable conditions and porosity and later the results will be studied for their correlation to groundwater quality.
3. RESEARCH RESULTS
3.1 Physical and chemical parameter test results
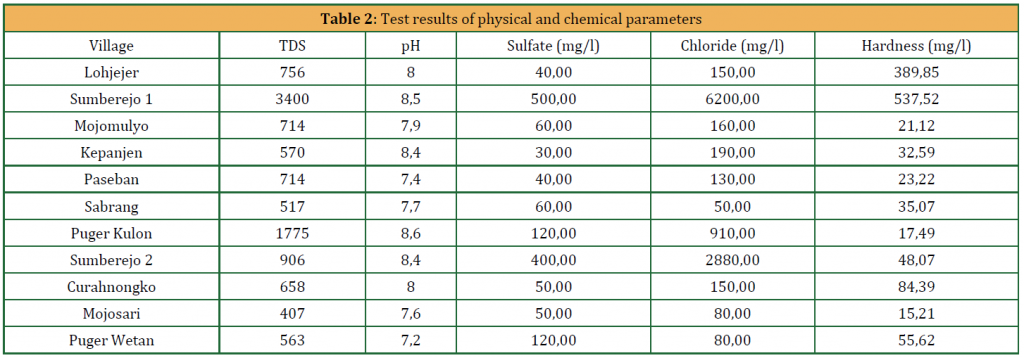
The results of groundwater quality research in the south coast from 11 villages showed significant variations in physical parameters such as TDS and chemistry including pH, Sulfate, Chloride, and Hardness. Total Dissolved Solids (TDS) varied between 407 mg/L in Mojosari to 3400 mg/L in Sumberejo 1. The pH values ranged from 7.2 in Puger Wetan to 8.6 in Puger Kulon, with the majority of villages having pH within a range that supports drinking water quality. The highest sulfate content was found in Sumberejo 1 with 500 mg/L, while other villages such as Lohjejer, Kepanjen, and Paseban showed lower levels of 40 mg/L, 30 mg/L, and 40 mg/L, respectively. Chloride levels also varied significantly, from a low of 50 mg/L in Sabrang to a high of 6200 mg/L in Sumberejo 1.
Water hardness, measured as CaCO₃ concentration, also showed wide variations. Lohjejer and Sumberejo 1 have the highest hardness values, 389.85 mg/L and 537.52 mg/L respectively, while Mojosari shows the lowest value of 15.21 mg/L. Curahnongko and Puger Wetan had moderate hardness, 84.39 mg/L and 55.62 mg/L respectively. The variation in measurement results reflects the different local geological and environmental conditions in each village where based on the Jember geological map of the south coast of Jember, there are seven geological formations including alluvium, argopuro tuff, puger, merubetiri, sukamade, and ampar stone formations. Villages that have high TDS, sulfate and chloride are likely affected by their proximity to the sea, which causes salt and minerals to enter the groundwater. In addition, human activities in the study area may contribute to the high chemical contaminants (Table 2)
3.2 Parameter classification results
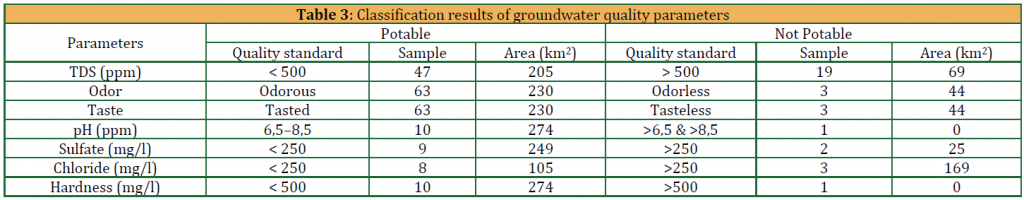
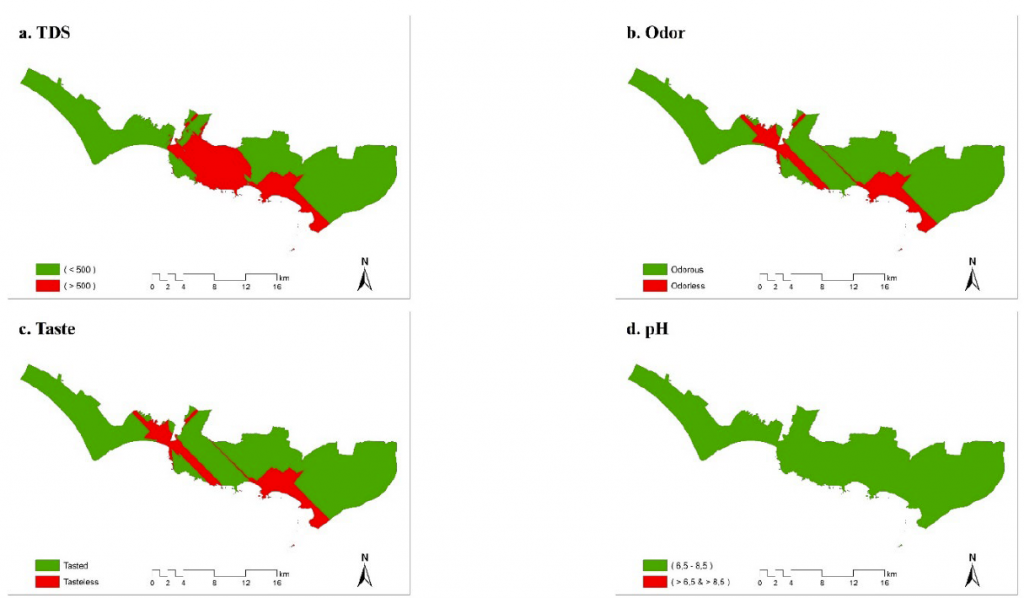
The parameter classification results obtained from the measurement of physical (TDS, odor, and taste) and chemical (pH, sulfate, chloride, and hardness) parameters in accordance with PERMENKES No. 492/MENKE/PER/IV/2010 respectively i.e. TDS evaluation found that 47 water samples, covering an area of 205 km², met the quality standard for drinking water (< 500 ppm), while 19 samples in another 69 km² exceeded this limit (> 500 ppm). In addition, odorless (63 samples, 230 km²) and tasteless (63 samples, 230 km²) water dominated the potable area, with only a few odorous (3 samples, 44 km²) and tasteless (3 samples, 44 km²)
samples not meeting the standard.
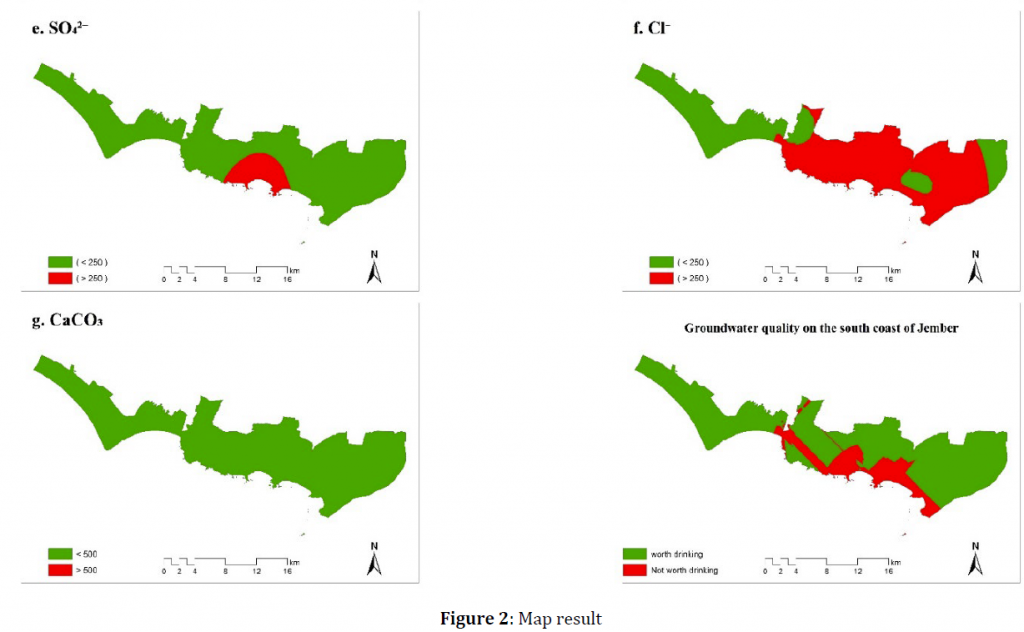
Chemical parameters including pH analysis showed that most samples (10 samples, 274 km²) had values within the range of 6.5-8.5 which is suitable for drinking water, while only 1 sample was outside this range (0 km²). For sulfate and chloride parameters, most samples met the quality standards (< 250 mg/L for sulfate and chloride), but some samples showed higher concentrations, especially for chloride (> 250 mg/L, 3 samples, 169 km²). Water hardness also showed similar results, with most samples (10 samples, 274 km²) meeting the standard (< 500 mg/L), although one sample showed high values (1 sample, 0 km²). This groundwater quality results data is presented in (Table 3).
3.3 Parameter Statistics
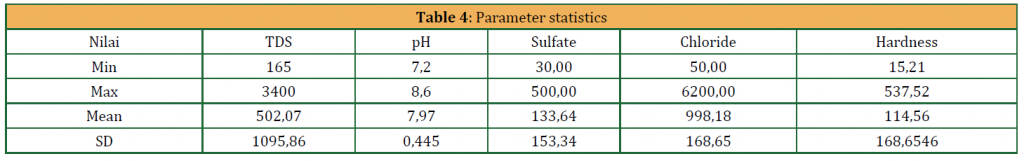
Statistical data on parameters in this study include water quality measurements, including Total Dissolved Solids (TDS), pH, sulfate, chloride, and hardness. TDS values ranged from 165-3400 mg/L with an average of 502.07 mg/L and a standard deviation of 1095.86 mg/L. pH ranged from 7.2-8.6 with an average of 7.97 and a standard deviation of 0.445. Sulfate ranged from 30-500 mg/L with a mean of 133.64 mg/L and a standard deviation of 153.34 mg/L. Chloride ranged from 50-6200 mg/L with a mean of 998.18 mg/L and a standard deviation of 168.65 mg/L. The hardness ranges from 15.21-537.52 mg/L with an average of 114.56 mg/L and a standard deviation of 168.65 mg/L. Based on the statistical data, it shows that the groundwater quality in the studied area has significant variations in each parameter measured. The majority of pH values are within the range that supports drinking water quality, but high values of TDS and chloride in some locations indicate contamination, indicating unsafe groundwater quality. High water hardness was also found in some villages indicating the water is not good for consumption.
3.4 Groundwater quality results
Based on tabel 3, The parameter classification results obtained from the measurement of physical (TDS, odor, and taste) and chemical (pH, sulfate, chloride, and hardness) parameters in accordance with PERMENKES No. 492/MENKE/PER/IV/2010 respectively i.e. TDS evaluation found that 47 water samples, covering an area of 205 km², met the quality standard for drinking water (< 500 ppm), while 19 samples in another 69 km² exceeded this limit (> 500 ppm). In addition, odorless (63 samples, 230 km²) and tasteless (63 samples, 230 km²) water dominated the potable area, with only a few odorous (3 samples, 44 km²) and tasteless (3 samples, 44 km²) samples not meeting the standard. Chemical parameters including pH analysis showed that most samples (10 samples, 274 km²) had values within the range of 6.5-8.5 which is suitable for drinking water, while only 1 sample was outside this range (0 km²). For sulfate and chloride parameters, most samples met the quality standards (< 250 mg/L for sulfate and chloride), but some samples showed higher concentrations, especially for chloride (> 250 mg/L, 3 samples, 169 km²). Water hardness also showed similar results, with most samples (10 samples, 274 km²) meeting the standard (< 500 mg/L), although one sample showed high values (1 sample, 0 km²). This groundwater quality results data is presented in.
Based on table 4, statistical data on parameters in this study include water quality measurements, including Total Dissolved Solids (TDS), pH, sulfate, chloride, and hardness. TDS values ranged from 165-3400 mg/L with an average of 502.07 mg/L and a standard deviation of 1095.86 mg/L. pH ranged from 7.2-8.6 with an average of 7.97 and a standard deviation of 0.445. Sulfate ranged from 30-500 mg/L with a mean of 133.64 mg/L and a standard deviation of 153.34 mg/L. Chloride ranged from 50-6200 mg/L with a mean of 998.18 mg/L and a standard deviation of 168.65 mg/L. The hardness ranges from 15.21-537.52 mg/L with an average of 114.56 mg/L and a standard deviation of 168.65 mg/L. Based on the statistical data, it shows that the groundwater quality in the studied area has significant variations in each parameter measured. The majority of pH values are within the range that supports drinking water quality, but high values of TDS and chloride in some locations indicate contamination, indicating unsafe groundwater quality. High water hardness was also found in some villages indicating the water is not good for consumption.
The results of the groundwater quality classification map on the south coast of Jember are the result of overlaying seven parameter maps including TDS, odor, taste, pH, Sulfate, Chloride, and Hardness. Based on the results of groundwater quality area in the southern coastal region of Jember shows that 47 km2 (17.8%) area is not suitable for drinking and 227 km2 (82.2%) area is suitable for drinking, it indicates that the majority of coastal areas have good water quality. The results of groundwater quality mapping with a geological review based on the geological map of the Jember sheet show that 47 km2 (17.8%) of non-drinkable areas are on alluvium plains interspersed with puger formations in the form of gampingan with rock lithology conditions that have a porosity level of 25-40% and permeability with a range of (10-10 – 10-7) which indicates that the material has a better ability to allow fluid flow. Materials with this permeability can allow water to flow more easily through their pores. While most of the other areas with a value and 227 km2 (82.2%) of potable areas are in the geology of sandstone and clay inserts with rock lithology characterized as having a porosity level of 5-35% and permeability with a range of 10-20 – 10-17 which indicates that the material is very difficult to pass through by the fluid. Rock lithologies with low porosity and permeability allow more time for natural filtration processes in the soil, which can help reduce contaminants such as solid particles, bacteria, and some chemicals (Ayuningrum et al., 2023).
4. CONCLUSION
Based on PERMENKES NO 492/MENKE/PER/IV/2010, physical and chemical testing of water showed that most samples were fit for drinking. Of the 66 samples, 47 samples were potable based on TDS, and 63 samples were potable based on odor and taste. Chemical test results also showed that the majority of samples met the quality standards. Groundwater quality in the southern coastal area of Jember showed 47 km² (17.8%) of areas not fit for drinking and 227 km² (82.2%) fit for drinking, indicating the majority of coastal areas have good water quality. Based on a geological review, the non-drinkable areas are located in alluvium plains and puger formations that have high porosity and permeability, while the drinkable areas are located in sandstone and clay with low porosity and permeability.
REFERENCES
Fetter, C.W., 2014. Applied Hydrogeology Fourth Edition. Pearson New Interbational Education: England.
Arivoli, S., Dhinamala, K., Persis, D., Meeran, M., and Pandeeswari, M. (2018). Analysis of physicochemical water quality parameters of Buckingham Canal, Chennai, Tamil Nadu, India. International Journal of Zoology Studies, 3(1), Pp 226-231.
Singhal, B.B.S. and Gupta, R.P., 2010. Applied Hydogeology of Fracture Rock. Springer Dordrecht Heidelberg, London: Springer.
Febriarta, E., 2020. Kajian kualitas air tanah dampak intrusi di sebagian pesisir Kabupaten Tuban. Jurnal Geografi: Media Informasi Pengembangan Dan Profesi Kegeografian, 17(2), Pp. 39-48.
Susiati, A., Hidayatullah, D., and Hidayatulloh, M. F., 2024. Perbandingan Berbagai Metode Pengukuran Geolistrik untuk Eksplorasi Air Tanah. Jupiter,Jurnal Pendidikan Teknik Elektro, 9(1), Pp. 48-54.
Indartin, T. R., and Mujib, M. A., 2020. Penilaian Kerentanan dan Resiko Pencemaran Air Tanah di Wilayah Karst. Jurnal Geografi UNESA, 11, 22.
Purnama S., 2010. Hidrologi Airtanah. Yogyakarta: Penerbit Kanisius.
Hounsinou S.P., 2020.Assessment of potential seawater intrusion in a coastal aquifer system at Abomey – Calavi, Benin.Heliyon.6(2).
Dhal, L., and Swain, S., 2022. Understanding and modeling the process of seawater intrusion: a review. Advances in remediation techniques for polluted soils and groundwater, Pp. 269-290.
Pratiwi, I. N. T., Yushardi, Y., Kurnianto, F. A., Astutik, S., and Apriyanto, B., 2022. Evaluasi dan Sebaran Kualitas Air Tanah Berdasarkan Parameter Litologi, Tekstur Tanah, dan Limbah di Kecamatan Kaliwates Kabupaten Jember. Majalah Pembelajaran Geografi, 5(2), Pp. 82-102.
Damayanti, C., Amukti, R., and Suyadi, S., 2020. Potensi vegetasi hutan mangrove untuk mitigasi intrusi air laut di pulau kecil. OLDI (Oseanologi dan Limnologi di Indonesia), 5(2), Pp. 75-91.
Sutrisno, C. Y., Purnomo, M. G. P., Saullah, D., Khunainin, R., Ramadhani, B., Lestari, C. N. I., and Pangastuti, E. I. Distribution Of Water Quality As A Result Of Seawater Intrution In Settlement Area Around Pancer Beach. In Social, Humanities, and Educational Studies (SHES): Conference Series (Vol. 5, No. 4, pp. 31-36).
Yusman, Y., Palippui, H., and Apriansah, A., 2019. Pemetaan Kualitas Air Tanah Wilayah Pesisir Kabupaten Majene. Riset Sains dan Teknologi Kelautan, Pp. 128-132.
Departemen Kesehatan Republik Indonesia. Peraturan menteri kesehatan republik indonesia nomor 492/menkes/per/IV/2010 tentang persyaratan kualitas air minum. Jakarta: Depkes RI; 2010.
Isaaks, Edward H. and Srivastava, R.M. 1989. Applied Geostatistics. Oxford University Press: New York.
Ayuningrum, V. R., Nurdin, E. A., Astutik, S., and Ikhsan, F. A., 2023. Pemetaan Persebaran Kualitas Air Sungai Irigasi pada Lahan Pertanian di Lereng Karst Gunung Sadeng Kecamatan Puger Kabupaten Jember. JPIG (Jurnal Pendidikan dan Ilmu Geografi), 8(1), Pp. 1-11.
| Pages | 475-479 |
| Year | 2024 |
| Issue | 4 |
| Volume | 8 |