IDENTIFICATION OF GREYWATER FLOW CHARACTERISTICS IN OPEN CHANNELS
Journal: Water Conservation and Management (WCM)
Author: Ratna Bachrun, Santi, Surya Baskara
Print ISSN : 2523-5664
Online ISSN : 2523-5672
This is an open access article distributed under the Creative Commons Attribution License CC BY 4.0, which permits unrestricted use, distribution, and reproduction in any medium, provided the original work is properly cited
Doi: 10.26480/wcm.02.2024.190.195
Abstract
 The aim of this research is to determine the nature and behavior (characteristics) of greywater flow in open channels. The source of greywater comes from tofu making, households, laundry, and workshops. The parameters used in identifying the flow are velocity, discharge, Reynold’s number, specific energy, and Froude number. The research method used is experimental research, by simulating an open channel model. Simulations were run on each greywater sample and four discharge variations. Velocity measurements were done vertically at the flow depth and at four horizontal measurement distances. The results showed that the largest velocity was in the tofu waste sample, which was 1.237–0.443 m/s, Reynold’s number was 224,228–22,003, and the specific energy was 0.15–0.02 m. Parameters that greatly affect the nature and behavior of flow are the type and composition of wastewater, velocity, and water level in open channels. The results of this study can be a reference for urban drainage planning.
Keywords
open channel, greywater, water level, velocity, characteristics
1. INTRODUCTION
As the population increases, greywater, which is the residue of clean water use, is also increasing. Greywater that is not treated and flowed properly will reduce environmental quality. Greywater is the result of a process or residue from an activity in liquid form whose presence is not desired by the environment because it has no economic value (Asmadi S., Si M., Suharno S.K.M., 2012). Open channels as a means of channeling greywater are generally widely used in the city of Kendari. An open channel is a channel that has a free surface (Triatmodjo, 2003). Knowledge of flow characteristics in the channel and greywater characteristics is very important to know in channel planning to avoid or reduce problems in urban drainage. Many studies have been conducted on the quality of wastewater from various sources. Research shows different greywater qualities for the same type of waste. The composition of greywater is influenced by many factors, namely the source of waste, activity, amount of water use, and regional conditions. Shaikh et al, reviewing the comparison of greywater quality from various countries, showed that greywater quality is more polluted in developing countries compared to developed countries. Greywater waste sources from kitchens and laundries are more polluted than bathrooms and sinks (Shaikh & Ahammed, 2020). The parameters commonly used in analyzing the characteristics of greywater are odor, temperature, density, color, turbidity, total suspended solids, total dissolved solids, viscosity, oil, detergent, and others.
Bachrun et al, identified the characteristics of greywater types in four different sources. Each greywater showed different parameter values. The parameters of density, specific gravity, oil and fat, and total suspended solids show the same value trend. Except for oil and fat parameters, total dissolved solids in tofu waste show a higher value compared to other wastes (Bachrun et al., 2020; Bachrun et al, 2023). The highest value of BOD and COD comes from the kitchen, namely BOD 250–100 mg/L and COD 840–3430 mg/L, while the lowest value comes from the bathroom (Khotimah et al., 2021). Tofu waste shows a TSS value of 64 mg/L, where this value match the quality standards, and BOD 150 mg/L and COD 7904 mg/L do not match the quality standards (Pambudi, 2021). Laundry waste parameters, which do not match the quality standards or show the highest values, are COD 3160 mg/L, TSS value 703 mg/L, phosphate value 4.20 mg/L, and oil and fat 25.25 mg/L (Nurhidayanti et al., 2022), and in the workshop waste, the Oil and fat parameter is 30.33, COD is 956 mg/L, BOD is 497.9 mg/L (Suryo Purnomo & Wijayanti, 2021).
The greywater parameter value represents the level of quality, which will then determine the type of greywater treatment or management so that it matches the quality standards (Shaikh & Ahammed, 2020; Yang et al., 2015). Dalahmeh et al reported that greywater characteristics are very important in determining the greywater treatment and reuse system. In addition, the flow and concentrations of greywater also have an impact on the filter response and hydraulic rate of on-site treatment (Dalahmeh et al., 2014). Bachrun et al reported in their research that the flow in closed channels is due to variations in greywater. The velocity of clean water samples is greater compared to other samples. The velocity is influenced by the greywater content; the greater the parameter value in greywater, the smaller the velocity value at the same water discharge (Bachrun et al., 2023). Bachrun et al, identified flows with sand sizes of 0.15 mm, 0.25 mm, and 0.42 mm at the same concentration. The greatest velocity was in the flow with 0.15 mm of sand. Grain size, sediment suspension, and velocity are parameters that can affect the flow conditions in a channel (Bachrun et al., 2021a; Nie et al., 2017; Ting et al., 2019). Variations in velocity result in the movement of particles in the pipe, and small velocities will cause deposition (Bachrun et al., 2021a; Wallwork et al., 2022). Safari et al suggested that the GS-GMDH model is the most effective in analyzing sediment transport in open channel flow. In developing the model using fluid characteristics, sediment flow, and channel modeling (Safari et al., 2019). In addition to greywater characteristics, the channel model also contributes to the flow characteristics (interaction occurs) (Bachrun et al., 2021b; Hassan & Shabat, 2023; Kong et al., 2023). Research by Suhudi, which analyzes specific energy with variations in the length of the threshold width in open channels, shows that the flow of Q3 discharge anda threshold width of 10 cm is an efficient flow where the energy loss is small and the Froud number is at 0.21 (Fr < 1) (Suhudi & Pandawa, 2022). In general, the parameters used to describe the nature and behavior of flow in open channels are water level or hydraulic depth, velocity, specific energy, energy loss, Reynold’s number, and Froude number.
In general, channels in Kendari City are not only sourced from one type of greywater but from several sources that gather together. This causes the composition of greywater to vary, especially household greywater. In planning channels that serve all types of greywaters that will enter, the selection of open and closed channel forms should be adjusted to the type of greywater. It is necessary to fulfill the minimum velocity of each greywater so that the performance of the channel is maintained. Identification of the nature and behavior of greywater in open channels is import, with the aim of providing an illustration of the effectiveness of closed and open channels. This study aims to identify the nature and behavior (characteristics) of greywater flow in open channels, find the relationship between parameters, and determine how much influence the characteristics of greywater have on open channels. The benefits of the research can be used as a reference in planning open channels in Kendari City.
2. METHODOLOGY
The research is an experimental study, which is research by simulating greywater in an open channel model. To realize the research aim, a methodology was designed. The methodology includes literature study, theoretical, open channel model design, greywater sample testing, preparation of simulation procedures, simulation implementation and data processing of simulation results. Data analysis is quantitative and qualitative.
2.1 Sample Characteristics
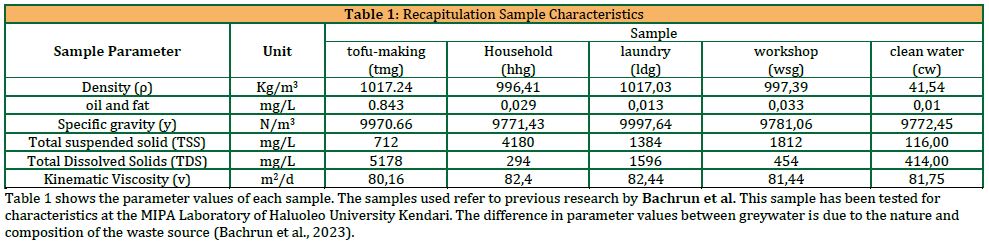
In this study, greywater samples were taken from Kendari City. The types of samples are clean water (cw), tofu making (tmg), households (hhg), laundry (ldg), and workshops (wsg). Sample characteristics have been tested to find each parameter value. Greywater parameters used were density (ρ), oil and fat, specific gravity (y), total suspended solids (TSS), total dissolved solids (TDS), and kinematic viscosity (v). The test results of graywater samples can be shown in Table 1.
2.2 Open Channel Modelling
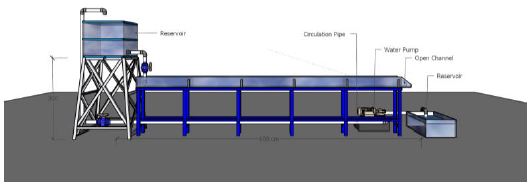
The open channel model is in 1:1 laboratory scale and acrylic material. The open-channel model is 600 cm long, 15 cm wide, and 30 cm high. The open channel model can be shown in Figure 1.
The open channel is completed with pipes for greywater circulation from the lower reservoir to the upper reservoir and a pump to supply water to the upper reservoir. The upper reservoir supplies water to the open channel (gravity system), and the lower reservoir collects water from the channel. During the simulation, the water flow will continue to circulate, and the flow condition is constant at each discharge.
2.3 Data Collection and Analysis
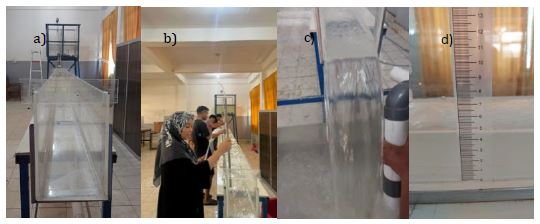
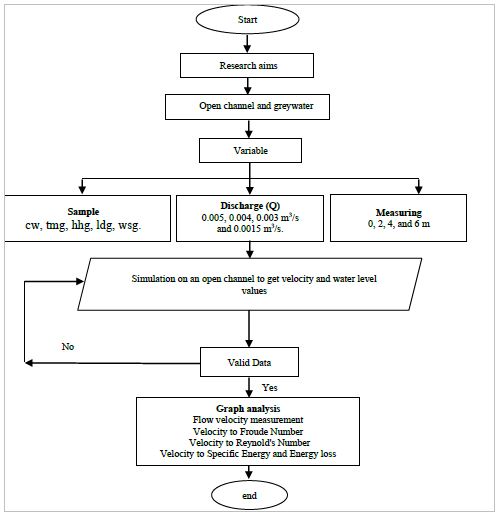
Total Simulation based on the amount of greywater samples and variations in discharge. Discharge was measured using a V-Notch upstream of the open channel. Velocity measurements were made using a pitot tube and then compared to manual discharge measurements and empirical equations. The discharge used is constant for all samples: 0.005 m3/s (Q1), 0.004 m3/s (Q2), 0.002 m3/s (Q3), and 0.015 m3/s (Q4). Horizontal velocity height measurements (x) are 0 , 2 , 4 , and 6 m. The first simulation of a clean water sample, discharge of 0.005 m3/s (Q1) and measurements at points (x) 0, 2, 4, and 6 m. The next simulation is for different discharges and samples. The simulation activity can be shown in Figure 2.
The data generated in the simulation are velocity and water level at various discharge, sample variations and the many points of measurement. The data is calculated using empirical equations (Triatmodjo, 1996, 2003) and analyzed to get the behavior or flow characteristics of each sample, the relationship between flow parameters and the value of these parameters. Flow characteristics using parameters of velocity (V), Reynold number (Re), Froude number (Fr), and specific energy (Es). The flow velocity (V) equation is:

Where V = velocity (m2/s), g = gravity (m/s2), h = height velocity (m). The Reynold’s Number (Re) Equation is :

Where Re = Reynold’s number, Re > 1,000 is turbulent, Re < 500 is laminar, R = hydraulic radius (m), V = flow velocity (m2/s), v = kinematic viscosity. The Froude Number (Fr) Equation is :

Where Fr = Froude number, Fr < 1 is sub critical, Fr = 1 is critical and Fr> 1 is super critical, V = flow velocity (m/s2), g = gravity (m/s2), y = water level (m). The Specific Energy (Es) Equation is:

Where, Es = Specific Energy (m), V = flow velocity (m2/s), g = gravity (m/s2), y = water level (m). Figure 3 shows the flowchart of this research.
3. RESEARCH RESULTS
Greywater simulation results in open channels are then analyzed to find flow characteristics and the value of each parameter relationship. The results of the analysis on the graph illustrate, four variations of discharge and four measurement points on each sample.
3.1 Flow Velocity
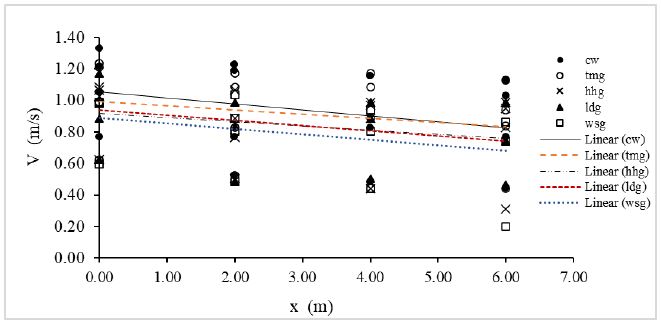
Velocity was calculated using empirical equations. The value of velocity at each measurement point can be shown in Figure 4.
Figure 4 shows the velocity value at the measurement point (x). The velocity in all samples shows the same behavior, where the more upstream the channel, there is a decrease in velocity. The clean water sample is the one that has the largest velocity. This is because this sample has a smaller parameter value compared to other samples. Clean water (cw) is a sample with parameter values that match the quality standard. The large velocity is due to the increase in volume, which increases the hydraulic radius of the open channel. Clean water (cw) velocity is 1.329–0.443 m/s, tofu making (tmg) is 1.237–0.443 m/s, household (hhg) is 1.085–0.313 m/s, laundry (ldg) is 1.172–0.465 m/s, and workshop (wsg) is 0.990–0.18 m/s.
3.2 Relationship of Velocity (V) to Froude Number (Fr)
The most important factors in flow are discharge (Q) and velocity (V). Variations in discharge (Q) are used to measure flow behavior or phenomena caused by increasing and decreasing the volume of water in the channel. The Froude number is used to determine the type of flow in an open channel. The Froude number (Fr) is Fr < 1 is sub critical, Fr = 1 is critical and Fr> 1 is super critical. The relationship between velocity (V) and Froude number (Fr) can be shown in Figure 5.
Figure 5 shows the relationship of velocity and Froude number (Fr). Clean water (cw) sample, velocity (V) at 1.329–0.443 m/s, and Froude number (Fr) at 1.73–1.12. Tofu making (tmg) sample, velocity (V) at 1.237–0.443 m/s, and Froude number (Fr) at 1.83–1.16. Household (hhg) sample, velocity (V) at 1.085–0.313 m/s, and Froude number (Fr) 1.53–1.00. Laundry (ldg) sample, velocity (V) at 1.172–0.465 m/s, and Froude number (Fr) at 1,49–1,14. Workshop (ldg) sample, velocity at 0.990–0.18 m/s, and Froude number (Fr) at 1,50–0,58. The flow types in the greywater samples almost all show supercritical flow (Fr>1). Household samples at a discharge of 0.015 m3/s and a measurement distance of 6 m show critical flow (Fr = 1). But workshop (ldg) samples at a discharge of 0.015 m3/s and measurement distances of 4 and 6 m showed critical (Fr = 1) and sub-critical (F < 1) flow (Triatmodjo, 2003). Conditions upstream generally affect the flow downstream. Velocity (V) and water level (y) are parameters that affect the Froude number (Fr) in open channels.
3.2 Relationship of Velocity (V) to Reynold’s Number (Re)
Reynold’s number in open channels is Re > 1,000, which is turbulent; Re < 500, which is laminar (Triatmodjo, 2003). Reynold’s number in open channels is influenced by velocity, and hydraulic radius is the ratio of the area and wet perimeter of the channel. The relationship of Reynold’s number (Re) to velocity (V) can be shown in Figure 6.
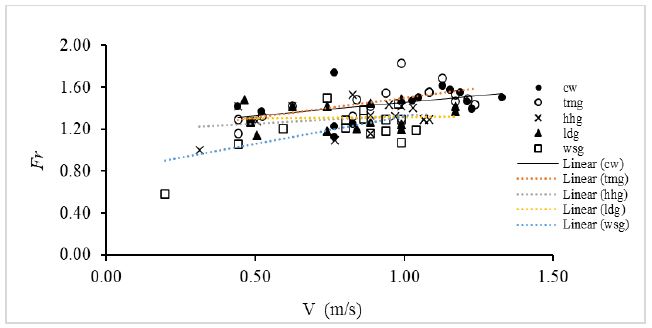
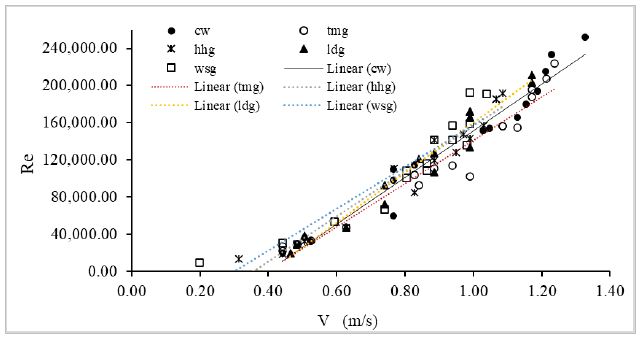
Figure 6: Relationship of Velocity (V) to Reynold’s Number (Re)
Figure 6 shows the relationship of velocity (V) to Reynold’s number (Re). Clean water (cw) sample, velocity (V) at 1.329–0.443 m/s, and Reynold’s number (Re) at 251688–19123 Tofu making (tmg) sample, velocity (V) at 1.237–0.443 m/s, and Reynold’s number (Re) at 224228–22003. Household (hhg) sample, velocity (V) at 1.085–0.313 m/s, and Reynold’s number (Re) at 191388–13270. Laundry (ldg) sample, velocity (V) at 1.172–0.465 m/s, Reynold’s number at 211030–19683. Workshop (ldg) sample, velocity (V) at 0.990–0.180 m/s, and Reynold’s number (Re) at 192577–9840. All samples show turbulent flow (Re > 1,000). The velocity value is linearly related to Reynold’s number; the greater the velocity, the more Reynold’s number also increases. The greater the discharge or volume of water, the higher the water level and wet cross section of the channel will increase.
3.4 Relationship of Velocity (V) to Specific Energy (Es) and Energy loss (ΔEs)
Energy is the power or force generated from the movement of solid and liquid substances or from changes in flow movement. Specific energy is the height of power at any cross section measured from the bottom of the channel, or the power of each unit weight of water at any cross section measured from the bottom of the channel (Triatmodjo, 1996, 2003). The relationship between velocity (V) and specific energy (Es) can be shown in Figure 7.
Figure 7 shows the relationship between velocity and specific energy. Clean water (cw), velocity (V) at 1.329–0.443 m/s, and specific energy (Es) at 0.17–0.02 m. Tofu making (tmg), velocity (V) at 1.237–0.443 m/s, and specific energy (Es) at 0.15–0.02 m. Household (hhg), velocity (V) at 1.085–0.313 m/s, and specific energy (Es) at 0.13–0.02 m. Laundry (ldg) velocity at 1.172–0.465 m/s and specific energy (Es) at 0.15–0.02 m. Workshop (ldg), velocity at 0.990–0.98, and specific energy (Es) at 0.14–0.02 m. The highwater level is expected to increase the specific energy value of the flow. Some factors that affect the height of the water level in open channels are the slope of the channel bottom, channel width, discharge, roughness, and others. Specific energy is directly proportional to the velocity and height of the water level; the greater the velocity and height of the water level, the greater the specific energy. This research is also the same as research by R. Bachrun et al, showing variations in flow discharge affect the water level and flow regimes in the pipe (Bachrun et al., 2020).
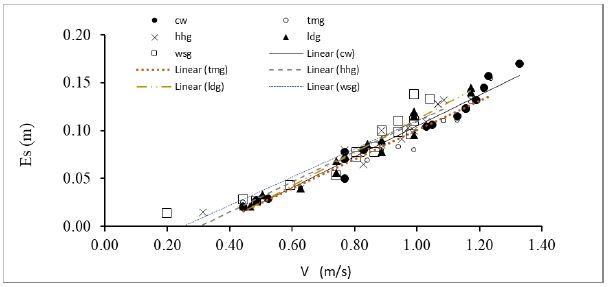
Figure 7: Relationship between velocity (V) and Specific energy (Es)
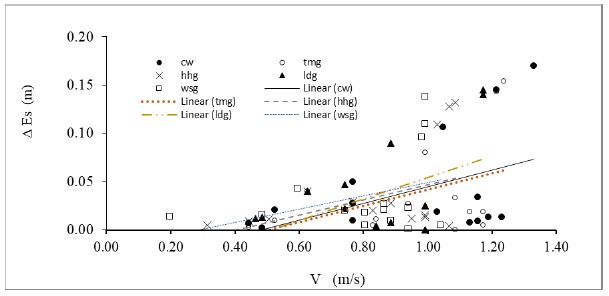
Figure 8: Relationship of Velocity (V) to Specific Energy Loss (ΔEs)
Figure 8 shows the relationship between velocity and specific energy loss. The measured velocity and water level at the channel cross section are not the same. At constant discharge, there is a change in the value of specific energy at a distance of 0, 2, 4, and 6 m. This difference in specific energy is called energy loss. Clean water (cw), average energy loss of 38.60%; tofu making (tmg), average energy loss of 32.15%; household (hhg), average energy loss of 39.03%; laundry (ldg), average energy loss of 42.79%; workshop (ldg), average energy loss of 45.29%. The largest specific energy loss in each sample is at a distance of 4 and 6 m. The more downstream the accumulation of energy loss, the bigger in specific energy, variations in water level occur due to changes in roughness, channel cross-sectional shape, base slope, or conditions upstream and downstream (Triatmodjo, 2003). R bachrun et al. in his research on energy loss in pipes with with greywater samples, the results show that energy loss is determined by velocity (V), friction coefficient (f) that occurs between flow particles and pipe walls, pipe dimensions (D), and flow length (L). In addition, greywater characteristics in the form of density and particle grain size also have an effect. Suhudi et al in their research, analyzed the specific energy before and after crossing the threshold. The results showed that the greatest energy loss occurred at a wide sill with a length of 10 cm in Q1 flow. The change in water level was greater in the wide sill Q1 channel with a length of 30 cm, while the Froude number and specific energy were greater in the wide sill Q1 channel with a length of 20 cm (Bachrun et al., 2020).
3.5 Flow Phenome in Open Channel
The results of the flow characteristics are caused by the interaction between the greywater and the open channel. The flow parameters impact each other. The amount or composition of greywater depends on its source The parameter values indicate the presence of dissolved and undissolved greywater content. Discharge variation, greywater sample variation, measurement distance and channel model which are the research parameters show different phenomena and behavior (Figure 9).
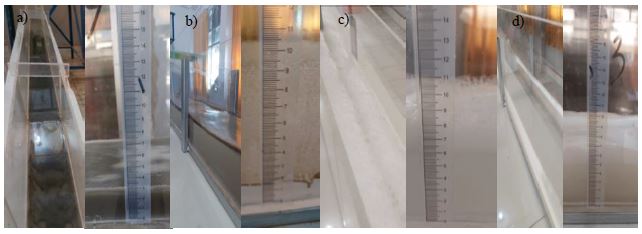
Figure 9: Flow phenomena in open channel (a) household, (b) tofu making, (c) workshop, (d) laundry
The flow behavior of laundry (ldg) greywater samples and tofu making (tmg) tends to be the same as clean water samples. The resulting flow velocity is similar to that of clean water (cw). Household greywater is greywater whose composition is very complex. This greywater contains animals and plants (open channels), solids, oil, fats and oils, sulphur, viruses, bacteria, animals, pH, gas, Odor, and colour (Asmadi S., Si M., Suharno S.K.M., 2012; Sugiharto, 2008). In addition to being liquid, household greywater also contains solids or sediment. These solids cannot be dissolved and have grain size and weight. Sediment has a falling velocity (gravity), and if it cannot be suspended in the flow, it will accumulate and settle to the bottom of the channel (Figure 9 a). For this reason, in greywater that contains solid particles or sediment, the flow velocity must be greater than the velocity of falling sediment. Greywater is called limit deposit velocity, which is the minimum velocity needed to avoid deposition in the channel. Workshop (wsg) waste comes from vehicle washing, oil changes, or vehicle repairs. The composition of water and oil tends to separate, where oil is always above water because the specific gravity of water is greater than that of oil. This phenomenon can be found in the Q3 and Q4 discharge variations. The remaining oil residue will affect the biological and chemical activities contained in the sample (Figure 9b).
Tofu making (tmg) waste comes from the remaining soybean processing. The main content of this waste is organic compounds in the form of proteins, carbohydrates, and fats. The volume of organic matter will increase with time. This phenomenon is like workshop waste; the remaining residue that spills will affect the flow in the channel (Figure 9 c). The main content of laundry waste is detergent. This condition is like oil and fat; detergent contains organic zinc, causing froth or bubbles along the flow. Large amounts of bubbles and froth can overflow the channel, reducing the volume and cross-section of the channel (Figure 9 d).
3. CONCLUSION
Knowledge of the characteristics of greywater and the flow characteristics that occur in the channel is very important. In order for channel performance to be achieved in the absence of water and deposition in the channel, it is important to determine the minimum velocity for each greywater source. Research on flow characteristics in open channels has not been completely investigated, especially in the form of greywater sources. The expected benefits of this study are to provide an overview of greywater quality and its impact on the environment. Provide an overview of the nature and behavior of the channel that occurs in the channel due to the influence of greywater characteristics. Can be used as a reference in channel planning.
In this study, it results in flow characteristics using the parameters of flow velocity (V), Reynolds number (Re), Froude number (Fr), and specific energy (Es) for each greywater. Clean water velocity is 1.329–0.443 m/s; tofu making is 1.237–0.443 m/s; household is 1.085–0.313 m/s; laundry is 1.172–0.465 m/s; and workshop is 0.990–0.819. The largest velocity is in the tofu waste; this is due to the value of the sample parameters, which tend to be smaller than other samples. Limit deposit velocity (LDV) in household waste samples is at a velocity of 0.313 m/s; at this velocity, the content of solid particles begins to settle. Energy loss significantly affects the flow characteristics.
This study recommends setting the minimum velocity for each greywater in drainage planning. pre-treatment before greywater is discharged into the channel, so that the parameter values match the greywater quality standards. It is recommended that research be done related to different types of greywaters, materials from channel models, and flow characteristics in channel models that include pre-treatment.
ACKNOWLEDGEMENTS
The Funding of this research was provided by DRTPM with a Higher Education Basic Research grant under the decision letter Number 0162/E5.4/DT.05.00/2023.
REFERENCES
- Asmadi S., Si M., Suharno S.K.M., K. M. (2012). Dasar-Dasar Teknologi Pengolahan Air Limbah. Gosyen Publishing.
- Bachrun, R., Pallu, M. S., Thaha, M. A., & Bakri, B. (2020). Effect of water discharge variation on water levels and flow characteristics in pipeline networks. IOP Conference Series: Earth and Environmental Science, 419(1), 012134. https://doi.org/10.1088/1755-1315/419/1/012134
- Bachrun, R., Pallu, M. S., Thaha, M. A., & Bakri, B. (2021a). Experimental Study On Characteristic of Slurry Flow Regime In Pipeline. International Journal of Engineering Trends and Technology, 69(7), 69–75. https://doi.org/10.14445/22315381/IJETT-V69I7P210
- Bachrun, R., Pallu, M. S., Thaha, M. A., & Bakri, B. (2021b). The effect of discharge on head loss with straight and bend flow directions in the pipeline. IOP Conference Series: Earth and Environmental Science, 841(1), 012017. https://doi.org/10.1088/1755-1315/841/1/012017
- Bachrun, R., Santi, & Baskara, S. (2023). Greywater Flow Characteristics for Closed Channel Maintenance. Civil Engineering Journal, 9(1), 29–40. https://doi.org/10.28991/CEJ-2023-09-01-03
- Dalahmeh, S. S., Pell, M., Hylander, L. D., Lalander, C., Vinnerås, B., & Jönsson, H. (2014). Effects of changing hydraulic and organic loading rates on pollutant reduction in bark, charcoal and sand filters treating greywater. Journal of Environmental Management, 132, 338–345. https://doi.org/10.1016/j.jenvman.2013.11.005
- Hassan, W. H., & Shabat, N. A. (2023). Numerical Investigation of the Optimum Angle for Open Channel Junction. Civil Engineering Journal, 9(5), 1121–1131. https://doi.org/10.28991/CEJ-2023-09-05-07
- Khotimah, S. N., Anisa Mardhotillah, N., Arifaini, N., & Sumiharni. (2021). Karakterisasi Limbah Cair Greywater pada level Rumah Tangga Berdasarkan Sumber Emisi. JURNAL SAINTIS, 21(02), 71–78. https://doi.org/10.25299/saintis.2021.vol21(02).7876
- Kong, L., Li, Y., Yuan, S., Li, J., Tang, H., Yang, Q., & Fu, X. (2023). Research on water level forecasting and hydraulic parameter calibration in the 1D open channel hydrodynamic model using data assimilation. Journal of Hydrology, 625, 129997. https://doi.org/10.1016/j.jhydrol.2023.129997
- Nie, S., Sun, H., Zhang, Y., Chen, D., Chen, W., Chen, L., & Schaefer, S. (2017). Vertical Distribution of Suspended Sediment under Steady Flow: Existing Theories and Fractional Derivative Model. Discrete Dynamics in Nature and Society, 2017, 1–11. https://doi.org/10.1155/2017/5481531
- Nurhidayanti, N., Ilyas, N. I., & Lazuardini, D. P. (2022). Studi Pengolahan Limbah Cair Laundry menggunakan Serbuk Biji Asam Jawa sebagai Biokoagulan. Jurnal Tekno Insentif, 16(1), 16–27. https://doi.org/10.36787/jti.v16i1.453
- Pambudi, Y. S. . C. S. G. G. (2021). Analisis karakteristik air limbah industri tahu dan alternatif proses pengolahannya berdasarkan prinsip-prinsip teknologi tepat guna. Syntax Literate: Jurnal Ilmiah Indonesia, 6(8), 4180–4192. https://doi.org/http://dx.doi.org/10.36418/syntax-literate.v6i8.3739
- Safari, M. J. S., Ebtehaj, I., Bonakdari, H., & Es-haghi, M. S. (2019). Sediment transport modeling in rigid boundary open channels using generalize structure of group method of data handling. Journal of Hydrology, 577, 123951. https://doi.org/10.1016/j.jhydrol.2019.123951
- Shaikh, I. N., & Ahammed, M. M. (2020). Quantity and quality characteristics of greywater: A review. Journal of Environmental Management, 261, 110266. https://doi.org/10.1016/j.jenvman.2020.110266
- Sugiharto. (2008). Dasar-dasar pengelolaan air limbah. UI-Press.
- Suhudi, & Pandawa, A. (2022). Analisis energi spesifik pada saluran terbuka dengan penambahan variasi panjang ambang lebar. Qua Teknika, 12(1), 25–44. https://doi.org/https://doi.org/10.35457/quateknika.v12i01.2106
- Suryo Purnomo, Y., & Wijayanti, F. D. (2021). Pengolahan Limbah Cair Bengkel Dengan Menggunakan Grease Trap Dan Fitoremediasi. EnviroUS, 2(1), 114–122. https://doi.org/10.33005/envirous.v2i1.87
- Ting, X., Xinzhuo, Z., Miedema, S. A., & Xiuhan, C. (2019). Study of the characteristics of the flow regimes and dynamics of coarse particles in pipeline transportation. Powder Technology, 347, 148–158. https://doi.org/10.1016/j.powtec.2019.02.031
- Triatmodjo, B. (1996). Hidraulika I (Pertama). Beta Offset.
- Triatmodjo, B. (2003). Hidraulika II. Beta Offset.
- Wallwork, J. T., Pu, J. H., Kundu, S., Hanmaiahgari, P. R., Pandey, M., Satyanaga, A., Khan, M. A., & Wood, A. (2022). Review of Suspended Sediment Transport Mathematical Modelling Studies. Fluids, 7(1), 23. https://doi.org/10.3390/fluids7010023
- Yang, J., Liu, H., Sun, J., Zhu, Y., Wang, X., Xiong, Z., & Jiang, W. (2015). Further Development of the Regional Boundary Layer Model to Study the Impacts of Greenery on the Urban Thermal Environment. Journal of Applied Meteorology and Climatology, 54(1), 137–152. https://doi.org/10.1175/JAMC-D-14-0057.
| Pages | 190-195 |
| Year | 2024 |
| Issue | 2 |
| Volume | 8 |
