ACCURACY OF CHIRPS SATELLITE RAINFALL DATA FOR RAINFALL-RUNOFF MODELLING IN TUKAD BADUNG WATERSHED
Journal: Water Conservation and Management (WCM)
Author: Mawiti Infantri Yekti, Luh Ayu Putri Wedayanti Pulasari, I Putu Gustave Suryantara Pariartha
Print ISSN : 2523-5664
Online ISSN : 2523-5672
This is an open access article distributed under the Creative Commons Attribution License CC BY 4.0, which permits unrestricted use, distribution, and reproduction in any medium, provided the original work is properly cited
Doi: 10.26480/wcm.02.2024.196.204
Abstract
 The availability of rainfall station on Bali Island based on the distribution map by River Basin Organization for Bali–Penida is still limited and not evenly distributed. This study aims to test the accuracy of rainfall data from the CHIRPS Satellite in representing rainfall events in the field. Satellite rainfall data and rainfall station data are transformed into discharge through HEC-HMS modeling. The resulting discharge is continuous flow discharge and design flood discharge. To determine the accuracy of satellite rainfall data, a comparison and verification are carried out with the rainfall station data and AWLR discharge as a reference. Verification is carried out using statistical tests such as RMSE, correlation coefficient (R), and coefficient of determination (R2). A comparison of CHIRPS and rainfall station in the Tukad Badung watershed shows that the CHIRPS has a good correlation with the rainfall station and the data can represent rainfall events in the field with R=0,698 and R2=0,484 in polynomial regression. For the verification results of the HEC-HMS continuous flow discharge model, 13 out of 15 variations of the analyzed data year have RMSE values from the CHIRPS Satellite which are superior to the rainfall station. For the verification results of the design flood discharge HEC-HMS model, the peak discharge from the CHIRPS Satellite is lower than the rainfall station with a difference of 43,98% – 46,47%. The trend of the HEC-HMS design flood peak discharge graph from the rainfall station and the CHIRPS is linear with the design flood peak discharge graph from the AWLR. So it can be decided that the CHIRPS on the Tukad Badung watershed has good accuracy that can represent rainfall events in the field and can be directly used for further hydrological analysis.
Keywords
Model Verification, Rainfall-Runoff Model, Satellite Rainfall Data
1. INTRODUCTION
The amount of river water availability can be determined by recording the discharge at the available water measurement post or through hydrological modeling analysis of rainfall into flow discharge. Therefore, rainfall data is very necessary to estimate the amount of flow in rivers (Limantara, 2018). The availability of rainfall stations on the island of Bali based on the distribution map of the River Basin Organization for Bali–Penida hydrology posts is still limited. The Bali Island is divided into 391 watersheds, but the number of rainfall stations is only 31 and the climatology posts are only 13 with positions that are not evenly distributed (DISPUPR, 2020). Under these conditions, rainfall recording does not adequately represent the amount of flow entering the river. Apart from that, the rainfall recording system at the available rainfall stations is still manual, so often occur human error. As technology develops, rainfall recording can be done by satellite. This data is recorded using a remote sensing system to obtain information about an object without making direct physical contact and utilizing satellites to assist the remote sensing process in more detail and globally (Elachi et al., 2021). It is hoped that the existence of rain recording using satellites can be used to facilitate data processing in areas that are far away or do not have rainfall stations. Satellite data cannot be used directly because it is the result of atmospheric rainfall measurements and estimates based on long-term infrared rainfall recording (Funk et al., 2015; Kiany et al., 2022). The estimated data certainly has differences from direct measurement data, so the level of accuracy needs to be tested first.
There are various satellites that record rainfall data, namely the Tropical Rainfall Measuring Mission (TRMM), Precipitation Estimation from Remotely Sensed Information using Artificial Neural Networks (PERSIANN), Global Precipitation Measurement Mission-The Integrated Multi-satellite Retrievals for GPM (GPM-IMERG), and Climate Hazards Group InfraRed Precipitation with Station (CHIRPS). The TRMM and PERSIANN satellites have a spatial resolution of 0.25°×0.25° (Kiany et al., 2022; Nguyen et al., 2019), the GPM-IMERG satellite has a spatial resolution of 0.1°×0.1° (Partarini et al., 2021), and the CHIRPS satellite has a spatial resolution of 0.05° ×0.05° (Funk et al., 2015). According to Kurniawan and Jendra, 2022, the GPM-IMERG satellite has higher spatial resolution with a smaller grid than TRMM, so it can be used for the Nusa Tenggara Barat region which is a small archipelago because it can represent the area evenly (Kurniawan and Jendra, 2022). Faisol et al., 2020 carried out a comparison between the GPM-IMERG satellite and the CHIRPS satellite in the Banyuwangi, Surabaya and Madura areas. The distribution of rain generated with CHIRPS satellite data is more detailed because it has a higher spatial resolution than the spatial resolution of the GPM-IMERG satellite (Faisol et al., 2020). According to Anjum et al., 2022, CHIRPS satellite data is better than the PERSIANN satellite in areas in Pakistan and monthly observation rainfall data has a better correlation than daily rainfall data (Anjum et al., 2022). This is relevant to research carried out by Atica, Halik and Saifurridzal, 2022 in the Jember region, Indonesia. CHIRPS and PERSIANN satellite data both have a strong correlation with monthly observed rainfall data, but CHIRPS satellite data has a higher correlation value than PERSIANN satellite data (Atica et al.,2022).
From the results of previous research that has been mentioned, it can be seen that the CHIRPS satellite has better performance and smaller grid than the TRMM, PERSIANN, and GPM-IMERG satellites, so it is able to represent areas on the Bali Island which are small islands. However, no one has evaluated CHIRPS on observed rainfall data in the Bali Island area. Therefore, in this research, as a novelty, CHIRPS will be used in one of the watersheds on the island of Bali, especially the Tukad Badung watershed.
Moreover, the CHIRPS in this research will be transformed into discharge and compared with observation discharge data. The Tukad Badung watershed has a perennial river so there are fluctuations in the river discharge. These discharge fluctuations need to be monitored continuously, so that rainfall-runoff modeling is needed. Furthermore, this modeling is also needed to solve the problem of limited time span in observation discharge data. So, in addition to comparing rainfall data, a comparison was also carried out with river discharge from the results of the rainfall runoff model related to these needs.
This research will analyze the level of accuracy between CHIRPS satellite data and hydrological postal data by comparing rainfall data and river discharge. The resulting level of accuracy will be evaluated to see whether it is good enough and capable of being used as an alternative data processing material if the number of nearby rainfall stations at the work location is limited. If proven to have good accuracy, then this satellite data can certainly make it easier for researchers to carry out data processing in areas with limited hydrological posts.
2. RESEARCH AREA
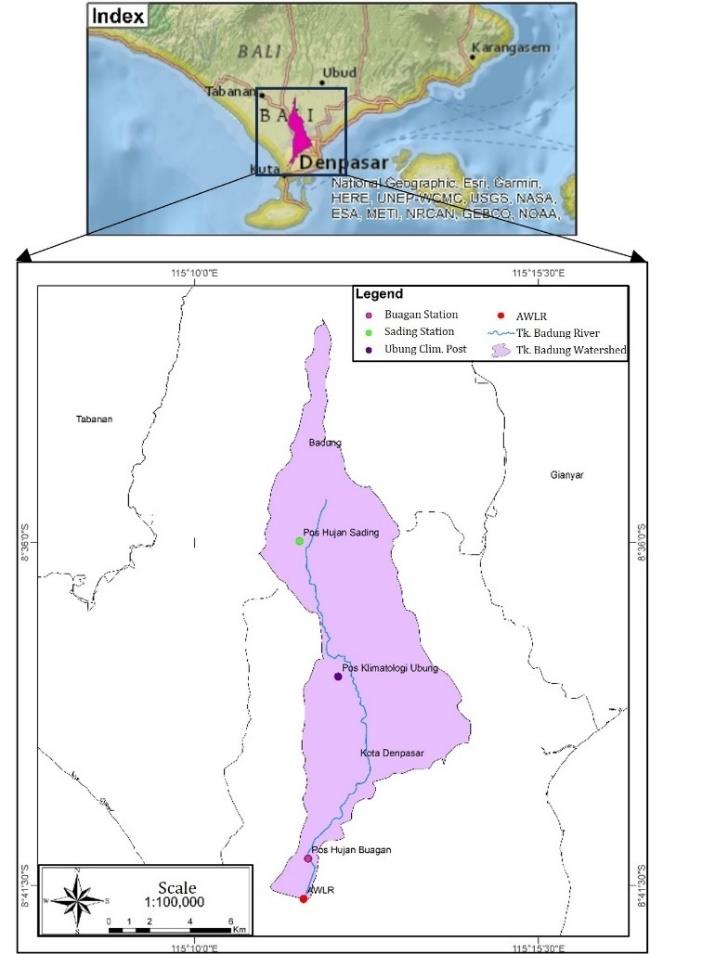
The research location is in the Tukad Badung Watershed with the Tukad Badung as main river which has a length of 14,524 km and a watershed area of 40,568 km2 (Balai Wilayah Sungai Bali-Penida, 2017). Tukad Badung river crosses Badung Regency and Denpasar City (figure 1). Tukad Badung river is perennial river with the continuous flow throughout the hydrological year, so it can be used for drainage, irrigation, tourism and also raw water (Wijayanti et al., 2015; Brintrup et al., 2019). Perennial river supporting significant environmental, economic, and Indigenous cultural values (Stoeckl et al., 2013; Hermose et al., 2018; Pusey et al., 2020). In the Tukad Badung watershed there are two rainfall stations and one climatology post for recording rainfall, and two water measurement posts for recording discharge. The number of hydrological posts in the Tukad Badung watershed is sufficient and the availability of this data is necessary to be able to carry out this research.
3. MATERIALS AND METHODS
Data to support this research uses secondary data. Map of the Badung Watershed, daily rainfall data in the Tukad Badung Watershed, and river flow data in the Tukad Badung Hilir AWLR for 2011–2020 were obtained from the River Basin Organization for Bali–Penida. Daily period rainfall data in the Badung watershed from the CHIRPS satellite for 2011–2020 is accessed via the Google Earth Engine Website. Earth Map with a scale of 1:25,000 accessed via the Indonesia Geospatial Portal Website. Soil type maps are accessed via the FAO Soils Portal Website. Land use map, obtained from processing earth maps using ArcGIS Software.
3.1 CHIRPS Satellite Rainfall Data
Rapidly developing technology now makes it possible to obtain rainfall data without physical measurements with measuring instruments, namely by utilizing remote sensing systems. The fast wide-reaching capabilities of satellite platforms enable monitoring of rapidly changing phenomena, especially in the atmosphere (Elachi et al., 2021). The amount of rainfall is predicted using satellites and the amount of rainfall in an area is obtained. Satellite rain recording data can be used to facilitate data processing in areas that are do not have or far away from rainfall stations.
Climate Hazards Group InfraRed Precipitation with Station (CHIRPS) is a land rainfall database developed by USGS and CHC (Climate Hazard Center) scientists from the University of California, Santa Barbara and is a combination of three rainfall information, namely global climatology, satellite-based rainfall estimates, and rainfall from in-situ observations such as from the Meteorology, Climatology and Geophysics Agency in Indonesia (Funk et al., 2015). CHIRPS provides daily, 5 daily, 10 daily, monthly, 2 monthly, 3 monthly rainfall data, with recording duration from 1981 to the present at a spatial resolution of 0.05° (Faisol et al., 2020). In this research, the CHIRPS used is CHIRPS Daily which provides daily rainfall data. CHIRPS Daily can be obtained through Google Earth Engine (GEE) on the website https://earthengine.google.com/ by entering the appropriate script.
3.2 Analytical Method
After all the data is collected, proceed with analyzing the quality of the rainfall data using the RAPS method consistency test. Then from the watershed map a Thiessen Polygon will be created with the help of ArcGIS software. From the Thiessen Polygon, the area of influence of each rainfall station in the watershed can be obtained by equation 1 or 2.


Explanation:

This area is used for regional average rainfall analysis. Next, the regional average rainfall is compared with rainfall from the CHIRPS satellite to see the correlation between the two data using the Determination Coefficient (R2) and Correlation Coefficient (R) methods.
Then, frequency analysis is carried out on CHIRPS Satellite rainfall data, rainfall stations rainfall data, and observed discharge to determine the value of design rainfall and flood discharge from observed discharge at various return periods. The distribution of hourly rainfall analysis is also carried out in order to calculate the design flood discharge at several return periods using the PSA 007 method. Land use map data and soil type maps were digitized using ArcGIS software to determine HSG and Curve Number, Impervious and Initial Abstraction values.
After all the data is ready, rainfall-runoff modeling is carried out from satellite rainfall data and rainfall station rainfall data to obtain continuous flow discharge and design flood discharge using HEC-HMS software. The discharge obtained from HEC-HMS modeling is compared with observed discharge. Then verification of the data comparison is carried out with statistical test using the Root Mean Squared Error (RMSE) method by equation 3. Then the final stage is drawing conclusions regarding the results of data verification.

Explanation:

4. RESULTS AND DISCUSSION
4.1 Data Consistency Test
The consistency test is carried out on rainfall data at the Sading Rainfall station, Buagan Rainfall station, Ubung Climatology Post, and rainfall data on the CHIRPS Satellite. the results of the consistency test show that all rainfall data are consistent.
4.2 Thiessen Polygon
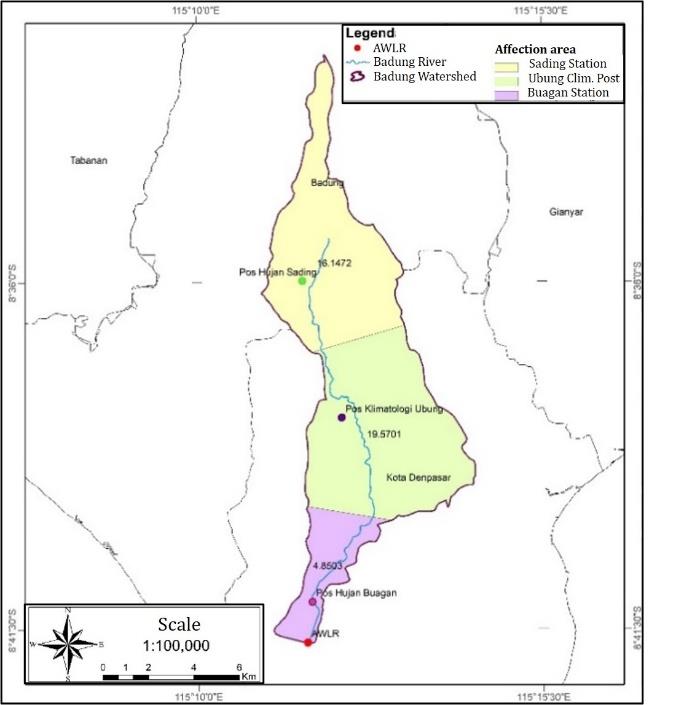
To determine the amount of rainfall in the Tukad Badung watershed, it is necessary to analyze the regional average rainfall, which is the average value of the rainfall recorded at each rainfall station. The regional average rainfall in this research uses the Thiessen Polygon Method. Rainfall at each rain post will be calculated based on the ratio of the rainfall stations affect area to the watershed in the Thiessen polygon and the average will be calculated. The results of digitizing the Thiessen polygon using ArcGIS showed a broad distribution of the rainfall stations affect area on the Tukad Badung watershed. The digitization results are presented in figure 2. From the digitization results, the affect area and thiessen coefficient are obtained which are presented in Table 1. After obtaining the affect area and thiessen coefficient, the analysis continues by calculating the regional average rainfall.

4.3 Frequency Analysis
Frequency analysis is carried out to determine the value of design rainfall and flood discharge from observed discharge at various return periods. The calculation results are presented in Table 2. This design rainfall value will be used to analyze the design flood discharge.
4.4 Correlation Test of CHIRPS Satellite Rainfall Data with Rainfall station Rainfall Data
The process of testing data correlation is carried out by calculating the correlation coefficient value. Furthermore, it can be done with the help of a scatter plot which aims to see the rain distribution pattern from two data and see the coefficient of determination value in several regression models. The values of the correlation coefficient and coefficient of determination can be used as a reference to determine the accuracy of CHIRPS Satellite rainfall data. Several regression models used in this research are as follows:
a. Linear regression model
b. Polynomial regression model
c. Power regression model
The correlation coefficient value is carried out by comparing 15 days period rainfall data at the rainfall station and CHIRPS Satellite. The comparison of the two rainfalls data can be seen in graph figure 2.

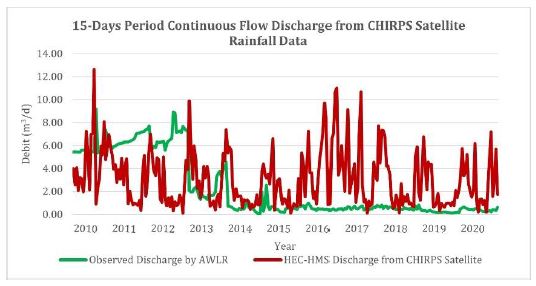
Based on Figure 3, it can be seen that the rainfall data from the CHIRPS Satellite has differences with the rainfall from the rainfall station. However, the difference is not too significant. The correlation coefficient value obtained from the comparison of the two data is 0,698. The correlation coefficient of 0.698 has a strong interpretation. This means that the two data tested have a good level of correlation. The correlation test is continued by determining the value of the coefficient of determination with the help of a scatter plot. Below is a scatter plot containing a comparison of the two data with several regression models:
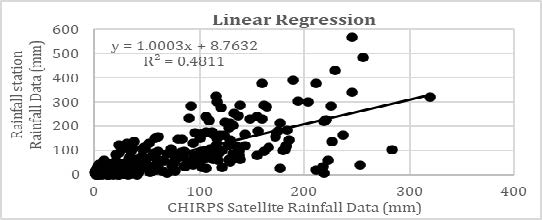
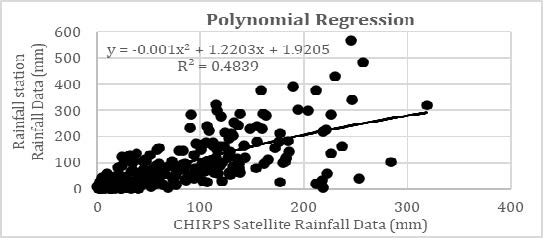
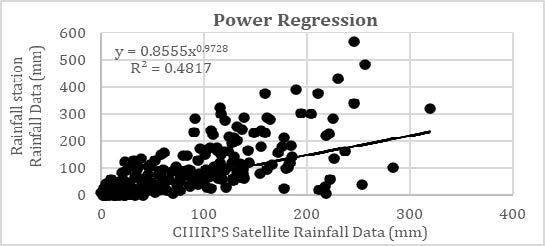

Based on the results in Table 3, the coefficient of determination value with a moderate interpretation and the correlation coefficient value with a strong interpretation are obtained, which shows that the rain data from the CHIRPS Satellite which is the result of remote sensing has a good correlation and is quite representative of the rain data from rainfall stations or field recording. Because it has good correlation, rain data from the CHIRPS Satellite does not need to be corrected. This data can be directly used for flow analysis and the results can be compared again with the flow rainfall results from rainfall station data.
4.5 The Distribution of Hourly Rainfall
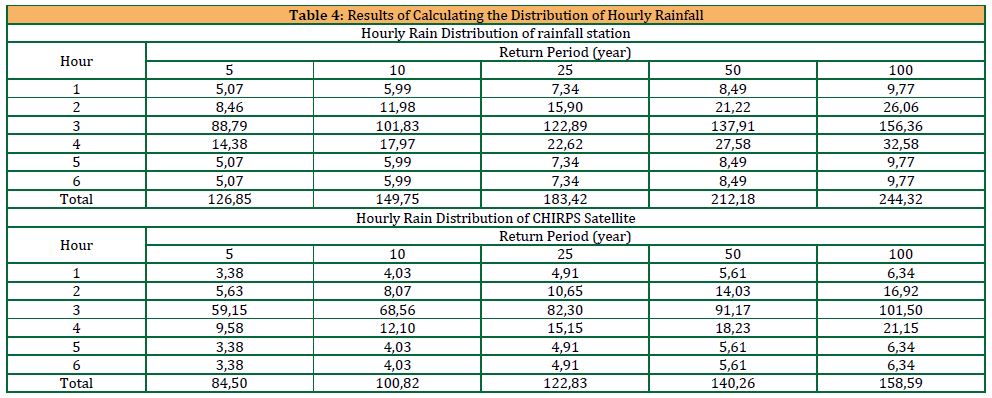
Rain distribution analysis is used to determine the design discharge value at a certain return period. In this research, to analyze the distribution of hourly rainfall, the PSA 007 method is used with a 6 hour distribution. Based on the 24-hour rainfall distribution table of the PSA 007 method at various return periods, the ratio of hourly rainfall with a duration of 6 hours is obtained. The results of calculating the distribution of hourly rainfall are presented in Table 4:
4.6 Curve Number, Impervious, and Initial Abstraction Value
Curve Number, Initial Abstraction, and Impervious are some of the parameters used to determine flow discharge using the SCS-CN Method. Curve Number (CN) is determined based on land use type and hydrological soil type (Hydrologic Soil Group (HSG)). Initial Abstraction depends on the CN value obtained. Impervious can be determined based on the type of land use alone without depending on the type of soil. Therefore, it is necessary to determine the type of soil and land use in the Tukad Badung watershed in order to determine the CN, Initial Abstraction and Impervious values.
Based on the soil type map in figure 5, it is known that the Tukad Badung watershed is dominated by 97.04% of the Ochric Andosols soil type with an area of 39,365 km2. For 2.96% of the downstream area, the soil type is Eutric Regosols with an area of 1,202 km2. Based on the book Morfologi dan Klasifikasi Tanah (Soil Morphology and Classification), the Ochric Andosols soil type has a dusty clay texture with a relatively low bulk density, with a value of < 0.90 g/cm3 which indicates that the soil has a good ability to pass water (Wirabuana and Hazriani, 2023). The Eutric Regosols soil type has a clayey sand texture. The HSG group in both types of soil is included in group B. The HSG in group B consists of loam, silt, dusty clay and sandy loam which have moderate infiltration rates and rather low runoff potential.
Based on the Earth Map obtained from the Indonesia Geospatial Portal website, it is known that the land use in the Tukad Badung watershed consists of farms, fields, residential, rice fields, shrubs and water bodies in the form of rivers. In figure 6, it can be seen that land use in the Tukad Badung watershed is dominated by 54% residential of the watershed area. For areas with the Ohcric Andosols soil type, the land use consists of farms, fields, residential, rice fields, shrubs and water bodies. For areas with Eutric Regosols soil type, the land use consists of farms, residential, rice fields, shrubs and water bodies.
The CN, Impervious and Initial Abstraction values can be determined based on the digitization of the soil type map and land use map in figures 4 and 5 and the results are presented in Table 5.
4.7 HEC-HMS Modeling Parameters
Modeling with HEC-HMS software is used to process rain data into discharge, both continuous flow discharge and design flood discharge. In this research, HEC-HMS software version 4.10 was used. There are several components that need to be completed to be able to do modeling. These components include basin models, meteorologic models, control specifications, and time series data. The various methods applied in this study are presented in Table 6, and the input parameter values of the hydrological model are presented in Table 7.


4.8 Results of Continuous Flow Discharge Modeling
In continuous flow discharge modeling, the rain data used is daily rainfall data from the CHIRPS Satellite and rainfall stations and daily discharge that recorded by AWLR. The time interval used is 1 day with a data length of 11 years from 1 January 2010 to 31 December 2020. So in the Control Specifications component, for this modeling it is set to use a time interval of 1 day with a time length of 11 years according to the time used in the Precipitation Gages. After the simulation is run, the results are obtained in the form of continuous flow discharge values for the daily period. In Figures 7 and 8, the results produced from the HEC-HMS simulation are shown in the form of graphs of continuous flow discharge values for a 15-day period.
4.9 Results of Design Flood Discharge Modeling
In the design flood discharge modeling, the rain data used is hourly rain distribution data with return periods of 5, 10, 25, 50 and 100 years. This data is input into the Precipitation Gages component. The time range used is 1 hour with a data length of 24 hours. So in the Control Specifications component, for this modeling it is set to use a time interval of 1 day with a time length of 11 years according to the time used in the Precipitation Gages.
Based on the simulation results, flood hydrographs were obtained in the Tukad Badung watershed which came from CHIRPS Satellite rainfall data and rain posts. The peak design flood discharge in both data occurs at the 4th hour. Because the control point used is downstream, calculating the design flood discharge requires a routing process. The peak design flood discharge that occurs in the upstream and downstream areas of course has differences due to the travel time of the flow from upstream to downstream, so that the peak discharge value and peak time will be different between downstream and upstream conditions. This method can estimate the hydrograph at one point in a river section based on observations of the hydrograph at another point. The design flood discharge upstream is an inflow, while the downstream discharge analyzed using the Routing method is an outflow. This routing method causes the value of the peak design flood discharge to decrease and the peak time to slow down. Previously, the peak discharge occurred at the 4th hour, after routing was carried out, the peak discharge occurred at the 5th hour with a lower value. In this research, the value of the peak design flood discharge from the modeling results after routing or outflow discharge is used to compare with the value of the peak design flood discharge from the AWLR recording which has been carried out by frequency analysis. A recapitulation of peak design discharge values from CHIRPS Satellite and ran gauge stationis rainfall data presented in Table 8.

4.10 Model Verification
To see the level of accuracy in the CHIRPS Satellite rain data, after modeling with HEC-HMS, the discharge from the modeling was compared with the discharge from the AWLR recording which was used as a control and the results were not good enough. This is caused by abnormal AWLR recording debit data, seen from the fluctuation of the discharge over 11 years from 2010-2020. The recorded debit value is very small and the fluctuation tends to be flat. This obstacle causes the verification process to
be less than optimal. Due to limitations in observational data, the verification process continues by comparing the high and low values of statistical tests on the comparison of observational data and HEC-HMS modeling from CHIRPS Satellite rainfall data with comparisons of observational data and HEC-HMS modeling from rainfall station rainfall data.
Model verification was carried out using the Root Mean Squared Error (RMSE) statistical test, correlation coefficient (R), Nash-Sutcliffe Efficiency (NSE), and T-test. Analysis using the correlation coefficient (R), NSE and T-test statistical tests yielded less representative results. In the NSE statistical test, the NSE value >0 or negative. In the two-sided T-test statistical test, with a confidence level of 5%, the value of tcount is negative and tcount < ‒tcritical. In the correlation coefficient (R) statistical test, a coefficient <0.6 was obtained with a low interpretation. In the RMSE statistical test, a relatively small RMSE value was obtained. So after the analysis is carried out, the statistical test chosen to verify this model is RMSE.
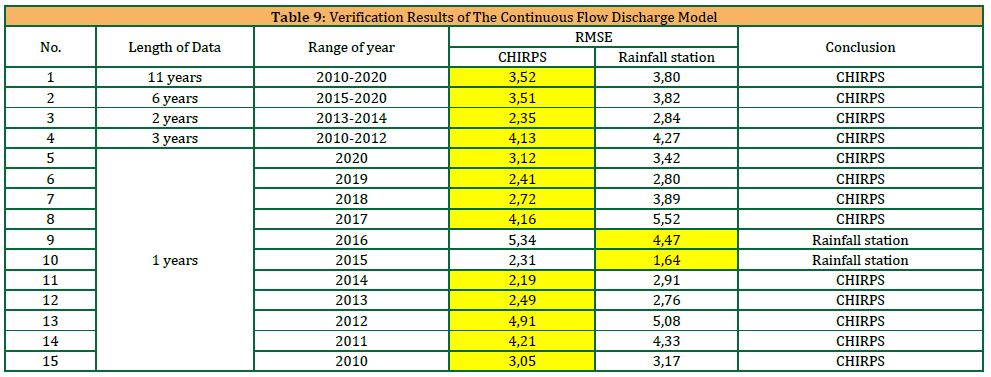
In continuous flow discharge model verification, there are variations in the verification time interval used. Based on table 9, the RMSE values are relatively small with a range of values 1,64 – 5,52.
For model verification with a data length of 1 year, of the 11 years analyzed in this model verification, 9 of them show that the RMSE value produced by the CHIRPS Satellite is superior to post-rainfall, and 2 of them show the opposite. To verify the model with a certain time range, of the 4 time range variations analyzed, all of them show that the RMSE value produced by the CHIRPS Satellite is superior to rainfall station. Based on these results, the verification results for a good continuous flow discharge model are dominated by the CHIRPS Satellite.

HEC-HMS from CHIRPS Satellite rainfall data and rainfall stations
Verification of the design flood discharge model is carried out using a trend comparison of the design peak flood discharge graph. For the design flood discharge resulting from HEC-HMS modeling, the peak discharge from the CHIRPS Satellite is lower than the post rain discharge with a difference of 43,98% – 46,47%. This is in accordance with previous research by (Wirabuana, 2023) who also carried out design flood discharge analysis using CHIRPS Satellite rainfall data and rainfall station rainfall data with the result that the design flood discharge value from CHIRPS Satellite rainfall data was lower than rainfall station ranfall data In this research, the trend of the HEC-HMS design flood peak discharge graph from the rainfall station and the CHIRPS Satellite is linear with the design flood peak discharge graph from the AWLR.
Comparison of modeling derived from CHIRPS and rainfall station shows results that are not much different, both in continuous flow discharge modeling and design flood discharge modeling. So it can be decided that the CHIRPS Satellite rain data in the Tukad Badung watershed has good accuracy and can represent rain events in the field and can be directly used for advanced hydrological analysis. So, based on this research, CHIRPS Satellite rain data in the Tukad Badung watershed can be used as an alternative if the availability of rain data at the rain post is inadequate.
5. CONCLUSION
After comparing modeling on CHIRPS satellite rain data and rain posts against observation data and carrying out verification to see the level of model accuracy, it was concluded that the rainfall data correlation results between CHIRPS and rainfall stations in the Tukad Badung watershed are R=0,698 and R2=0,484 in polynomial regression. This value shows that CHIRPS has a good correlation with rain posts and the data can represent rain events in the field and can be directly used for further analysis without requiring a correction stage.
The verification results of the HEC-HMS continuous flow discharge model were good, dominated by the CHIRPS. This is indicated by the RMSE value in modeling from CHIRPS which is superior to modeling from rainfall station data. Of the 15 time range variations analyzed, 13 of them showed that the RMSE value produced by the CHIRPS Satellite was superior to the rainfall station.
The verification results of the HEC-HMS model of the designed flood discharge, it was found that the peak discharge from the CHIRPS Satellite was lower than the rainfall post with a difference of43,98% – 46,47%. The trend of the HEC-HMS design flood peak discharge graph from the rainfall station and the CHIRPS Satellite is linear with the HEC-HMS design flood peak discharge graph from the AWLR. So that CHIRPS in the Tukad Badung watershed has good accuracy and can represent rainfall events in the field and can be directly used for advanced hydrological analysis.
REFERENCE
- Anjum, M. N., Waseem, M., Kebede Leta, M., Niazi, U. M., Rahman, S. u., Ghanim, A., Mukhtar, M. A., Nadeem, M.U., 2022. Assessment of PERSIANN-CCS, PERSIANN-CDR, SM2RAIN-ASCAT, and CHIRPS-2.0 Rainfall Products over a Semi-Arid Subtropical Climatic Region et al., Assessment of Persiann-Ccs, Persiann-Cdr, Sm2rain-ASCAT, and CHIRPS-2.0 Rainfall Products over a Semi-Arid Subtropical Climatic Region,” Water (Switzerland), vol. 14, no. 2, 2022, doi: 10.3390/w14020147.
- Atica, A. N. T. L., Halik, G., and Saifurridzal, 2022. Prediksi Curah Hujan menggunakan Data Hujan Satelit CHIRPS dan PERSIANN-CDR di DAS Bedadung Kabupaten Jember, J. Tek. Sumber Daya Air, vol. 2, no. 2, Pp. 69–80, 2022.
- Balai Wilayah Sungai Bali-Penida, 2017. Peta Sebaran Pos Hidrologi, Denpasar.
- Brintrup, K., Amigo, C., Fernández, J., Hernández, A., Pérez, F., Félez-Bernal, J., Butturini, A., Saez-Carrillo, K., Yevenes, M. A. and Figueroa, R., et al., “Comparison of Organic Matter in Intermittent and Perennial Rivers of Mediterranean Chile with The Support of Citizen Science,” Rev. Chil. Hist. Nat., vol. 3, pp. 1–10, 2019.
- DISPUPR, 2020. Dirjen SDA BWS Bali-Penida, Wilayah Administrasi, sda.pu.go.id.
- Elachi, C., van, J., Zyl., 2021. Introduction to the Physics and Techniques of Remote Sensing, Third Edit. California: John Wiley and Sons, Inc.,
- Faisol, A., Indarto, I., Novita, E., and Budiyono, B., 2020. Komparasi antara Climate Hazards Group Infrared Precipitation With Stations (CHIRPS) dan Global Precipitation Measurement (GPM) dalam membangkitkan Informasi Curah Hujan Harian di Provinsi Jawa Timur, J. Teknol. Pertan. Andalas, vol. 24, no. 2, Pp. 148, 2020, doi: 10.25077/jtpa.24.2.Pp. 148-156.
- Funk, C., Peterson, P., Landsfeld, M., Pedreros, D., Verdin, J., Shukla, S., Husak, G., Rowland, J., Harrison, L., Hoell, A., Michaelsen, J., et al., 2015.The Climate Hazards Infrared Precipitation with Stations, A New Environmental Record for Monitoring Extremes, Sci. Data, Pp. 1–21, doi: 10.1038/sdata.2015.66.
- Gunawan, J., Hazriani, R., and Mahardika, R. Y., 2020. Morfologi dan Klasifikasi Tanah. Pontianak: Untan Press, 2020.
- Hermose, V., Cattarino, L., Linke, S., and Kennard, M. J., 2018. Catchment Zoning to Enhance Co-Benefits and Minimise Trade-Offs between Ecosystem Services and Biodiversity Conservation,” Aquat. Conserv. Mar. Freshw. Ecosyst., vol. 28, Pp. 1004–1014, doi: https://doi.org/10.1002/aqc.2891.
- Kiany, M. S. K., Masoodian, S. A., Balling, R. C. Jr., and Darand, M., 2022. Evaluation of Tropical Rainfall Measuring Mission, Integrated Multi-satellite Retrievals for GPM, Climate Hazards Centre InfraRed Precipitation with Station Data, and European Centre for Medium-Range Weather Forecasts Reanalysis v5 Data in Estimating Prec, R. Meteorol. Soc., vol. 42, no. 4, Pp. 2039–2064, 2022, doi: https://doi.org/10.1002/joc.7351.
- Kurniawan, I., and Jendra, M. D., 2022. Evaluasi Data GPM-IMERG (Global Precitipation Measurement – Integrated Multi-Satellite Retrieval For GPM) di Provinsi NTB, Megasains, vol. 13, no. 01, Pp. 6–13, 2022, doi: 10.46824/megasains.v13i01.62.
- Limantara, L. M., 2018. Rekayasa Hidrologi, Revisi. Andi Offset.
- Nguyen, P., Eric, J., Shearer, Tran, H., Ombadi, M., Hayatbini, N., Palacios, T., Huynh, P., Braithwaite, D., Updegraff, G., Hsu, K., Kuligowski, B., Logan, W. S., Soroosh, et al., 2019. The CHRS Data Portal, an Easily Accessible Public Repository for PERSIANN Global Satellite Precipitation Data, Sci. Data, vol. 6, Pp. 1–10, doi: 10.1038/sdata.2018.296.
- Partarini, N. M. C., Sujono, J., and Pratiwi, E. P. A., 2021. Koreksi dan Validasi Data Curah Hujan Satelit GPM-IMERG dan CHIRPS di DAS Selorejo, Kabupaten Malang,” Pros. CEEDRiMS Pp. 149–156.
- Pusey, B. J., Jackson, S., Douglas, M., Allsop, Q., Olden, J. D., and Kennard, M. J., 2020. Connectivity, Habitat, and Flow Regime Influence Fish Assemblage Structure: Implications for Environmental Water Management in a Perennial River of The Wet – Dry Tropics of Northern Australia,” Aquat. Conserv. Mar. Freshw. Ecosyst., vol. 30, no. March, Pp. 1397–1411, 2020, doi: 10.1002/aqc.3347.
- Stoeckl, N., Jackson, S., Pantus, F., Finn, M., Kennard, M. J., and Pusey, B. J., 2013. An Integrated Assesment of Financial, Hydrological, Ecological and Social Impacts of Development’ on Indigenous and Non-Indigenous People in Northern Australia, Biol. Conserv., vol. 159, Pp. 214–221, doi: https://doi.org/10.1016/j.biocon.2012.12.007.
- Wijayanti, N., Siaka, I. M., and Widihati, I. A. G., Kim., J., 2015. Spesiasi dan Bioavailabilitas Logam Berat Timbal (Pb) dan Tembaga (Cu) dalam Sedimen Sungai Tukad Badung, vol. 9, no. 2, Pp. 211–216, 2015.
- Wirabuana, L. M., 2023. Pemanfaatan Data Hujan Climate Hazards Group Infrared Precipitation with Station Data (CHIRPS) untuk Estimasi Banjir di DAS Sidutan, Universitas Mataram.
| Pages | 196-204 |
| Year | 2024 |
| Issue | 2 |
| Volume | 8 |

